Optimizing DeepseekV3 Inference on SGLang Using ROCm Profiling Tools#

As LLMs are growing in size and complexity, ensuring proper utilization of compute resources becomes of prime importance. Performance profiling and kernel-level analysis are essential techniques for diagnosing runtime bottlenecks, such as GPU time, memory-bound operations, and inefficient device-host memory transfers etc. By using profiling tools like RocmProfileData (RPD) and TorchProfiler (PyTorch Profiler) developers have access to granular level insight into kernel execution timelines, data movement patterns, and computational hotspots. In this blog, we delve into how profiling and kernel diagnostics can expose inefficiencies in components like attention mechanisms and Mixture-of-Experts (MoE) layers — and guide targeted optimizations at the kernel level.
DeepseekV3 Model Architecture#
A deep understanding of the DeepseekV3 model architecture and inference call stack in SGLang is essential for relative kernels after profiling and address any gaps in the SGLang code. DeepseekV3 is a Mixture -of-Experts (MoE) model with 671B parameters with 37B activated to process each input token. It adopts Multi- Latent Attention (MLA) and DeepseekMoE architecture and outperforms other open-source models with excellent performance. MLA compresses KV cache into a single, lower dimension joint latent vector containing the relevant information. The core of MLA lies in low-rank joint compression of attention keys and values vector to reduce the memory used for Key-Value (KV) cache during inference while maintaining performance comparable to standard Multi-Head Attention (MHA) as shown in Figure 1. MHA enables faster inference but due to KV Cache overhead makes it difficult to scale for larger size models. Compared with traditional MoE architectures like GShard, DeepSeekMoE uses finer-grained experts and isolates some experts as shared ones. In DeepSeekMoE’s architecture, shared experts are reused across multiple layers and are always activated for all tokens, providing general-purpose knowledge. In contrast, fine-grained experts are selectively activated based on the token’s content, allowing specialization based on what each token needs to accomplish. To gain deeper insights into the kernel level, we perform a series of optimizations, which are detailed in the following section.
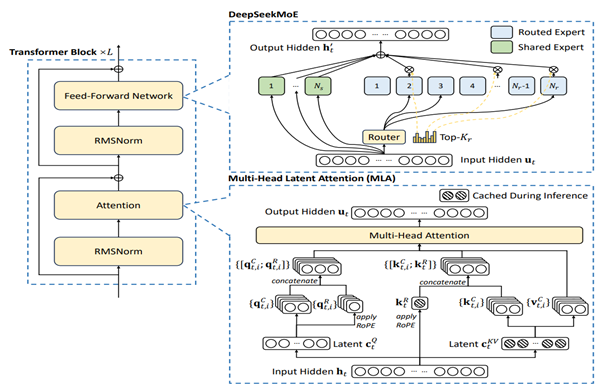
Figure 1. Basic Architecture of DeepseekV3 depicting DeepseekMOE and MLA#
The Performance Optimization Cycle for LLMs#
To systematically optimize large language models (LLMs) on modern GPU architectures, we follow a structured performance tuning/optimization workflow.
The full optimization cycle, as illustrated in Figure 2, consists of several key stages:
End-to-end performance benchmarking establishes a baseline for the entire LLM pipeline, offering a top-down view of the complete workflow — not just individual operations like attention or matrix multiplication.
Roofline analysis helps assess how effectively the LLM leverages the underlying hardware’s computational capabilities (e.g., peak FLOPs on MI300X GPU).
Profiling and kernel breakdowns involve extracting GPU traces using tools like RPD or torch.profiler, enabling in-depth kernel-level analysis and comparison with NVIDIA-based profiles.
Gap identification and iterative tuning: Based on profiling insights, key bottlenecks are identified, and targeted optimizations are applied iteratively to reach peak performance.
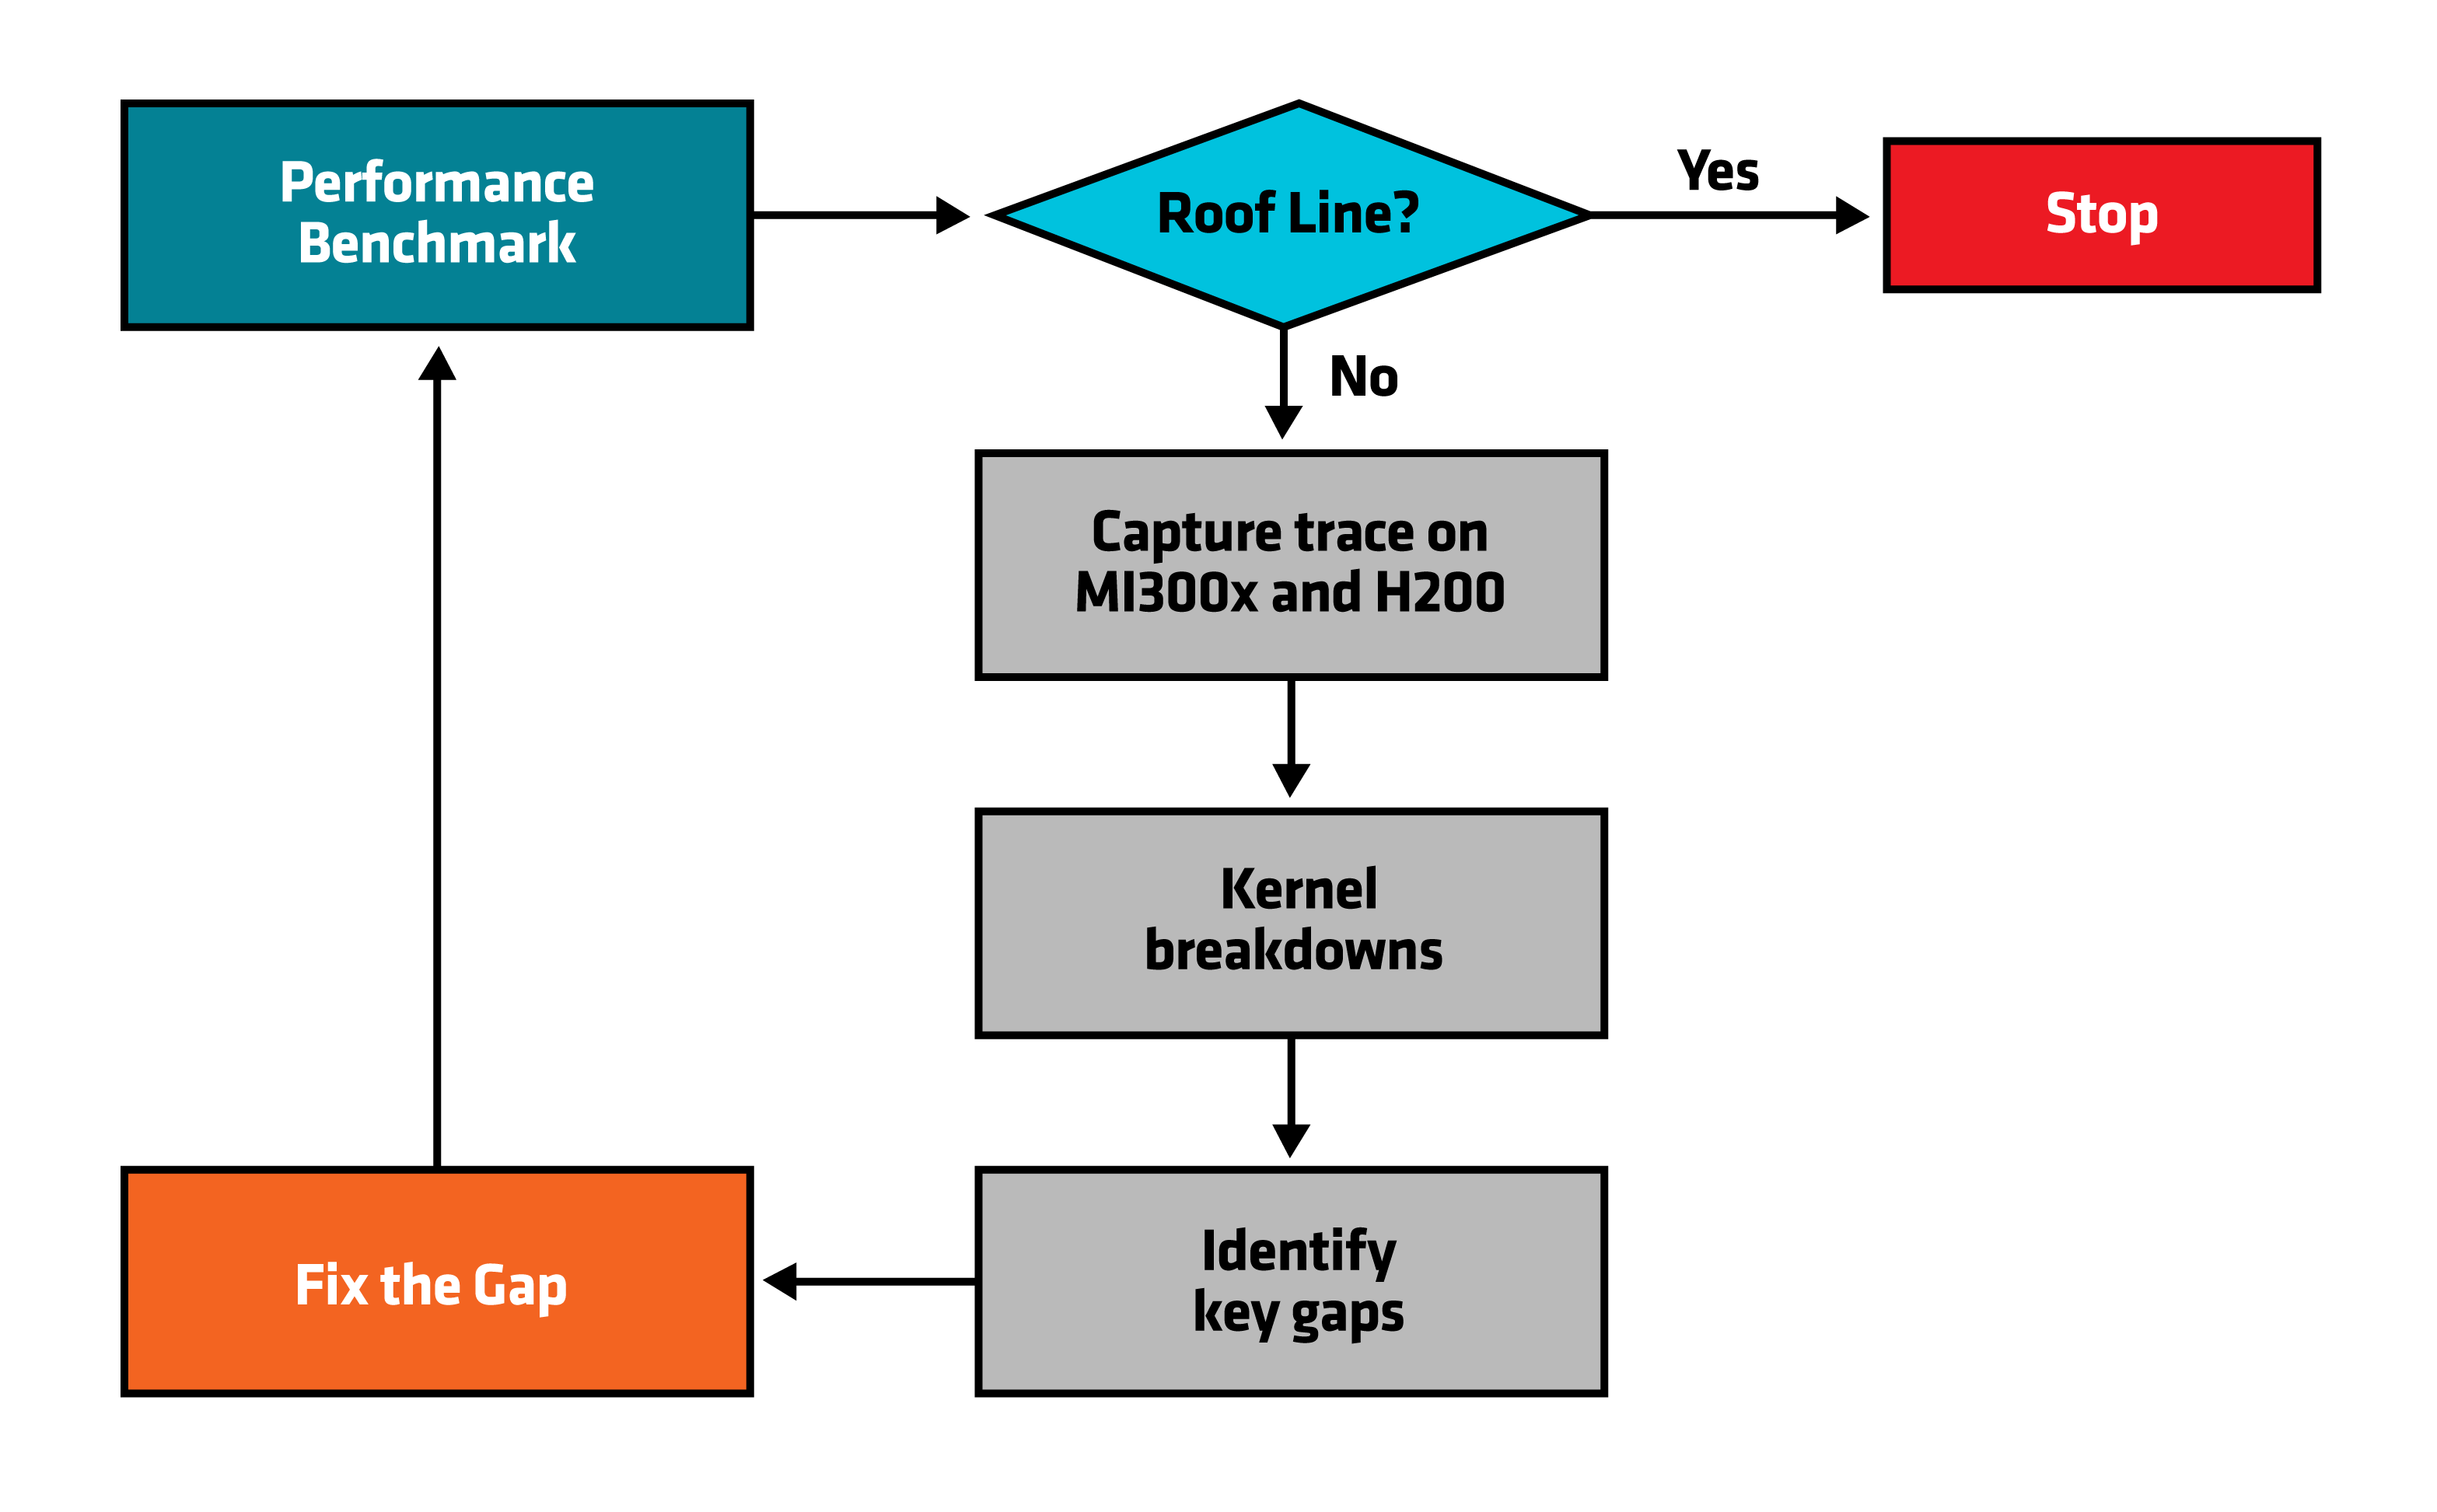
Figure 2. Performance Optimization Cycle#
Performance Profiling and Kernel Analysis#
Profiling GPU performance involves systematically analyzing how graphic processing units handle various computational tasks to identify bottlenecks and optimize overall efficiency. It enables developers to gain deep insights into how their applications utilize GPU resources, pinpointing areas such as memory bandwidth limitations, computation inefficiencies, or poor parallelism that may negatively impact performance. Typically, GPU profiling tools measure metrics like kernel execution times, memory transfers, utilization of cores, occupancy levels, and power consumption, thereby providing detailed diagnostic information on the execution behavior of an application.
AMD provides multiple profiling tools, some of them are defined below:
Radeon™ GPU Profiler (RGP)
RocmProfileData (RPD)
ROCprofiler
TorchProfiler (PyTorch Profiler)
In this blog, we focus on using RPD and Torch Profiler to profile the Deepseek model on SGLang
RocmProfileData (RPD)
ROCm Profile Data is a collection of tools for tracing and analyzing gpu related activity on a system. This is represented by a timeline of api calls, app log messages, async gpu operations, and related interactions/dependencies.
TorchProfiler (PyTorch Profiler)
An efficient way to understand the DeepseekV3 call stack in SGLang is by using the Torch Profiler (torch.profiler), a performance analysis tool from PyTorch. It facilitates detailed performance analysis by identifying code bottlenecks, measuring operation execution times, and optimizing the model’s behavior during inference.
Using online serving RPD and Pytorch Profiler we are able to gain a deeper insight into how a workload behaves so that we can identify gaps by combining the profiler output with source code. Figure 3 below captures a torch.profiler trace that includes the initial dump of CPU+GPU call stack showing how many call stack it takes for an attention forward kernel to be invoked. Figure 4 below shows a zoomed-in GPU calls trace capture during online serving for H200 AND MI300X. stack for H200 vs MI300X GPU.
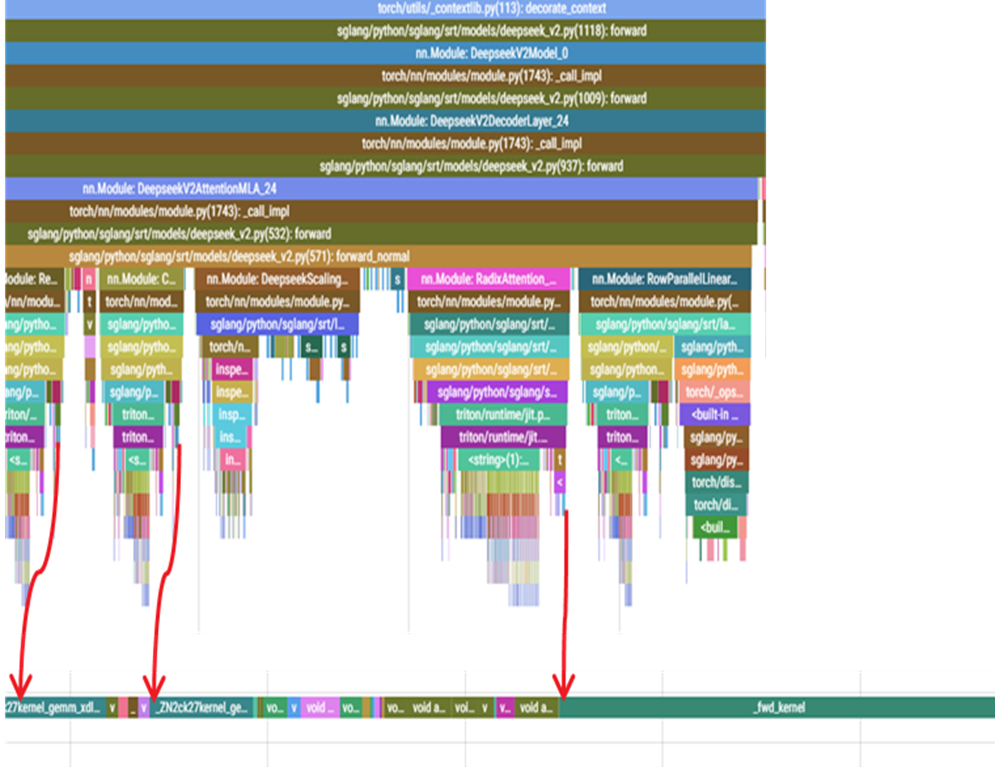
Figure 3.Trace capture during online serving#
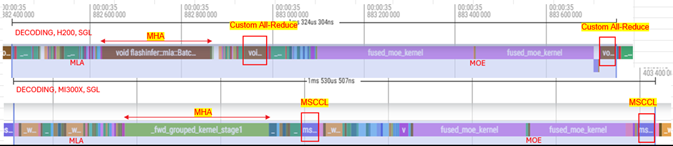
Figure 4. Zoomed in version for trace capture during online serving for H200 AND MI300X#
Capturing GPU Traces with RocmProfileData (RPD)#
Let’s now walk through a step-by-step process to capture a trace using SGLang by RPD.
Step 1. Enable RPD Tracing in SGLang
Launch SGLang Container
Make sure you are inside the running `SGLang` container before
continuing.
Step 2. Install RPD and Enable RPDT_AUTOFLUSH
# Clone the RPD repository
 git clone https://github.com/ROCm/rocmProfileData.git

# Install required dependencies
 apt-get install sqlite3 libsqlite3-dev libfmt-dev

# Build and install RPD
 cd rocmProfileData/
 make
 make install

# Install Python bindings
 cd rocpd_python
 python setup.py install

# Enable autoflush
 export RPDT_AUTOFLUSH=1
Step 3. Launch SGLang Server with RPD Tracing
runTracer.sh python3 -m SGLang.launch_server \
   --model deepseek-ai/DeepSeek-V3 \
   --tp 8 \
   --trust-remote-code \
   --disable-radix-cache
Step 4. Launch the Client
# Set benchmark parameters
 prompts=16
 con=16
 isl=3200
 osl=800

# Run the client
 python3 -m sglang.bench_serving \
   --backend SGLang \
   --dataset-name random \
   --random-range-ratio 1 \
   --num-prompt $prompts \
   --random-input $isl \
   --random-output $osl \
   --max-concurrency $con
Note: After the client run completes and performance data is collected, stop the server using Ctrl + C.
Step 5. Convert .rpd to .json
python3 rocmProfileData/tools/rpd2tracing.py trace.rpd trace.json --start 98% --end 100%
Capturing GPU trace with TorchProfiler#
Let’s now walk through a step-by-step process to capture a trace using SGLang by TorchProfiler.
Step 1. Create a Server Script (server.sh)
export SGLANG_TORCH_PROFILER_DIR=/sgl-workspace/profile/

TIMESTAMP=$(date +"%Y%m%d_%H%M%S")
 LOGFILE="SGLang_server_log_$TIMESTAMP.json"

export HSA_NO_SCRATCH_RECLAIM=1

python3 -m SGLang.launch_server \
   --model deepseek-ai/DeepSeek-V3 \
   --tp 8 \
   --trust-remote-code \
   --disable-radix-cache
Run the server: bash server.sh
Step 2. Create a Client Script (client.sh)
curl http://localhost:30000/start_profile

python3 -m sglang.bench_serving \
   --backend SGLang \
   --dataset-name random \
   --random-range-ratio 1 \
   --num-prompt 128 \
   --max-concurrency 128 \
   --random-input 3200 \
   --random-output 5
   --profile

curl http://localhost:30000/stop_profile
Run the client in a new terminal: bash client.sh
Step 3. Trace Output
It may take 1–2 minutes after the server shuts down for the trace to be fully generated. You’ll find the trace in:/sgl-workspace/profile/
Step 4. Visualize the Trace
Go to https://ui.perfetto.dev and upload your .json trace file for visualization.
Kernel Trace Analysis#
Reviewing the kernel traces, we identified the primary bottleneck as inefficient device-to-host memory transfers — specifically, data being copied from the GPU back to the CPU. Additionally, the attention and Mixture-of-Experts (MoE) kernels were found to consume a significant portion of GPU time. This is largely due to standard implementations involving extensive memory transfers, numerous matrix multiplications, tokens dispatching across multiple experts, execution of expert-specific MLPs, and the subsequent aggregation of results. Table 1 (below) depicts a sample of kernel level breakdowns between MI300X vs Nvidia H200. We can identify that during decode phase the latency for MLA is 2x less and MoE is 3x less vs Nvidia H200. Updating the attention and Mixture-of-Experts (MoE) kernels played a big role in cutting down GPU time which we will cover in a future blog.
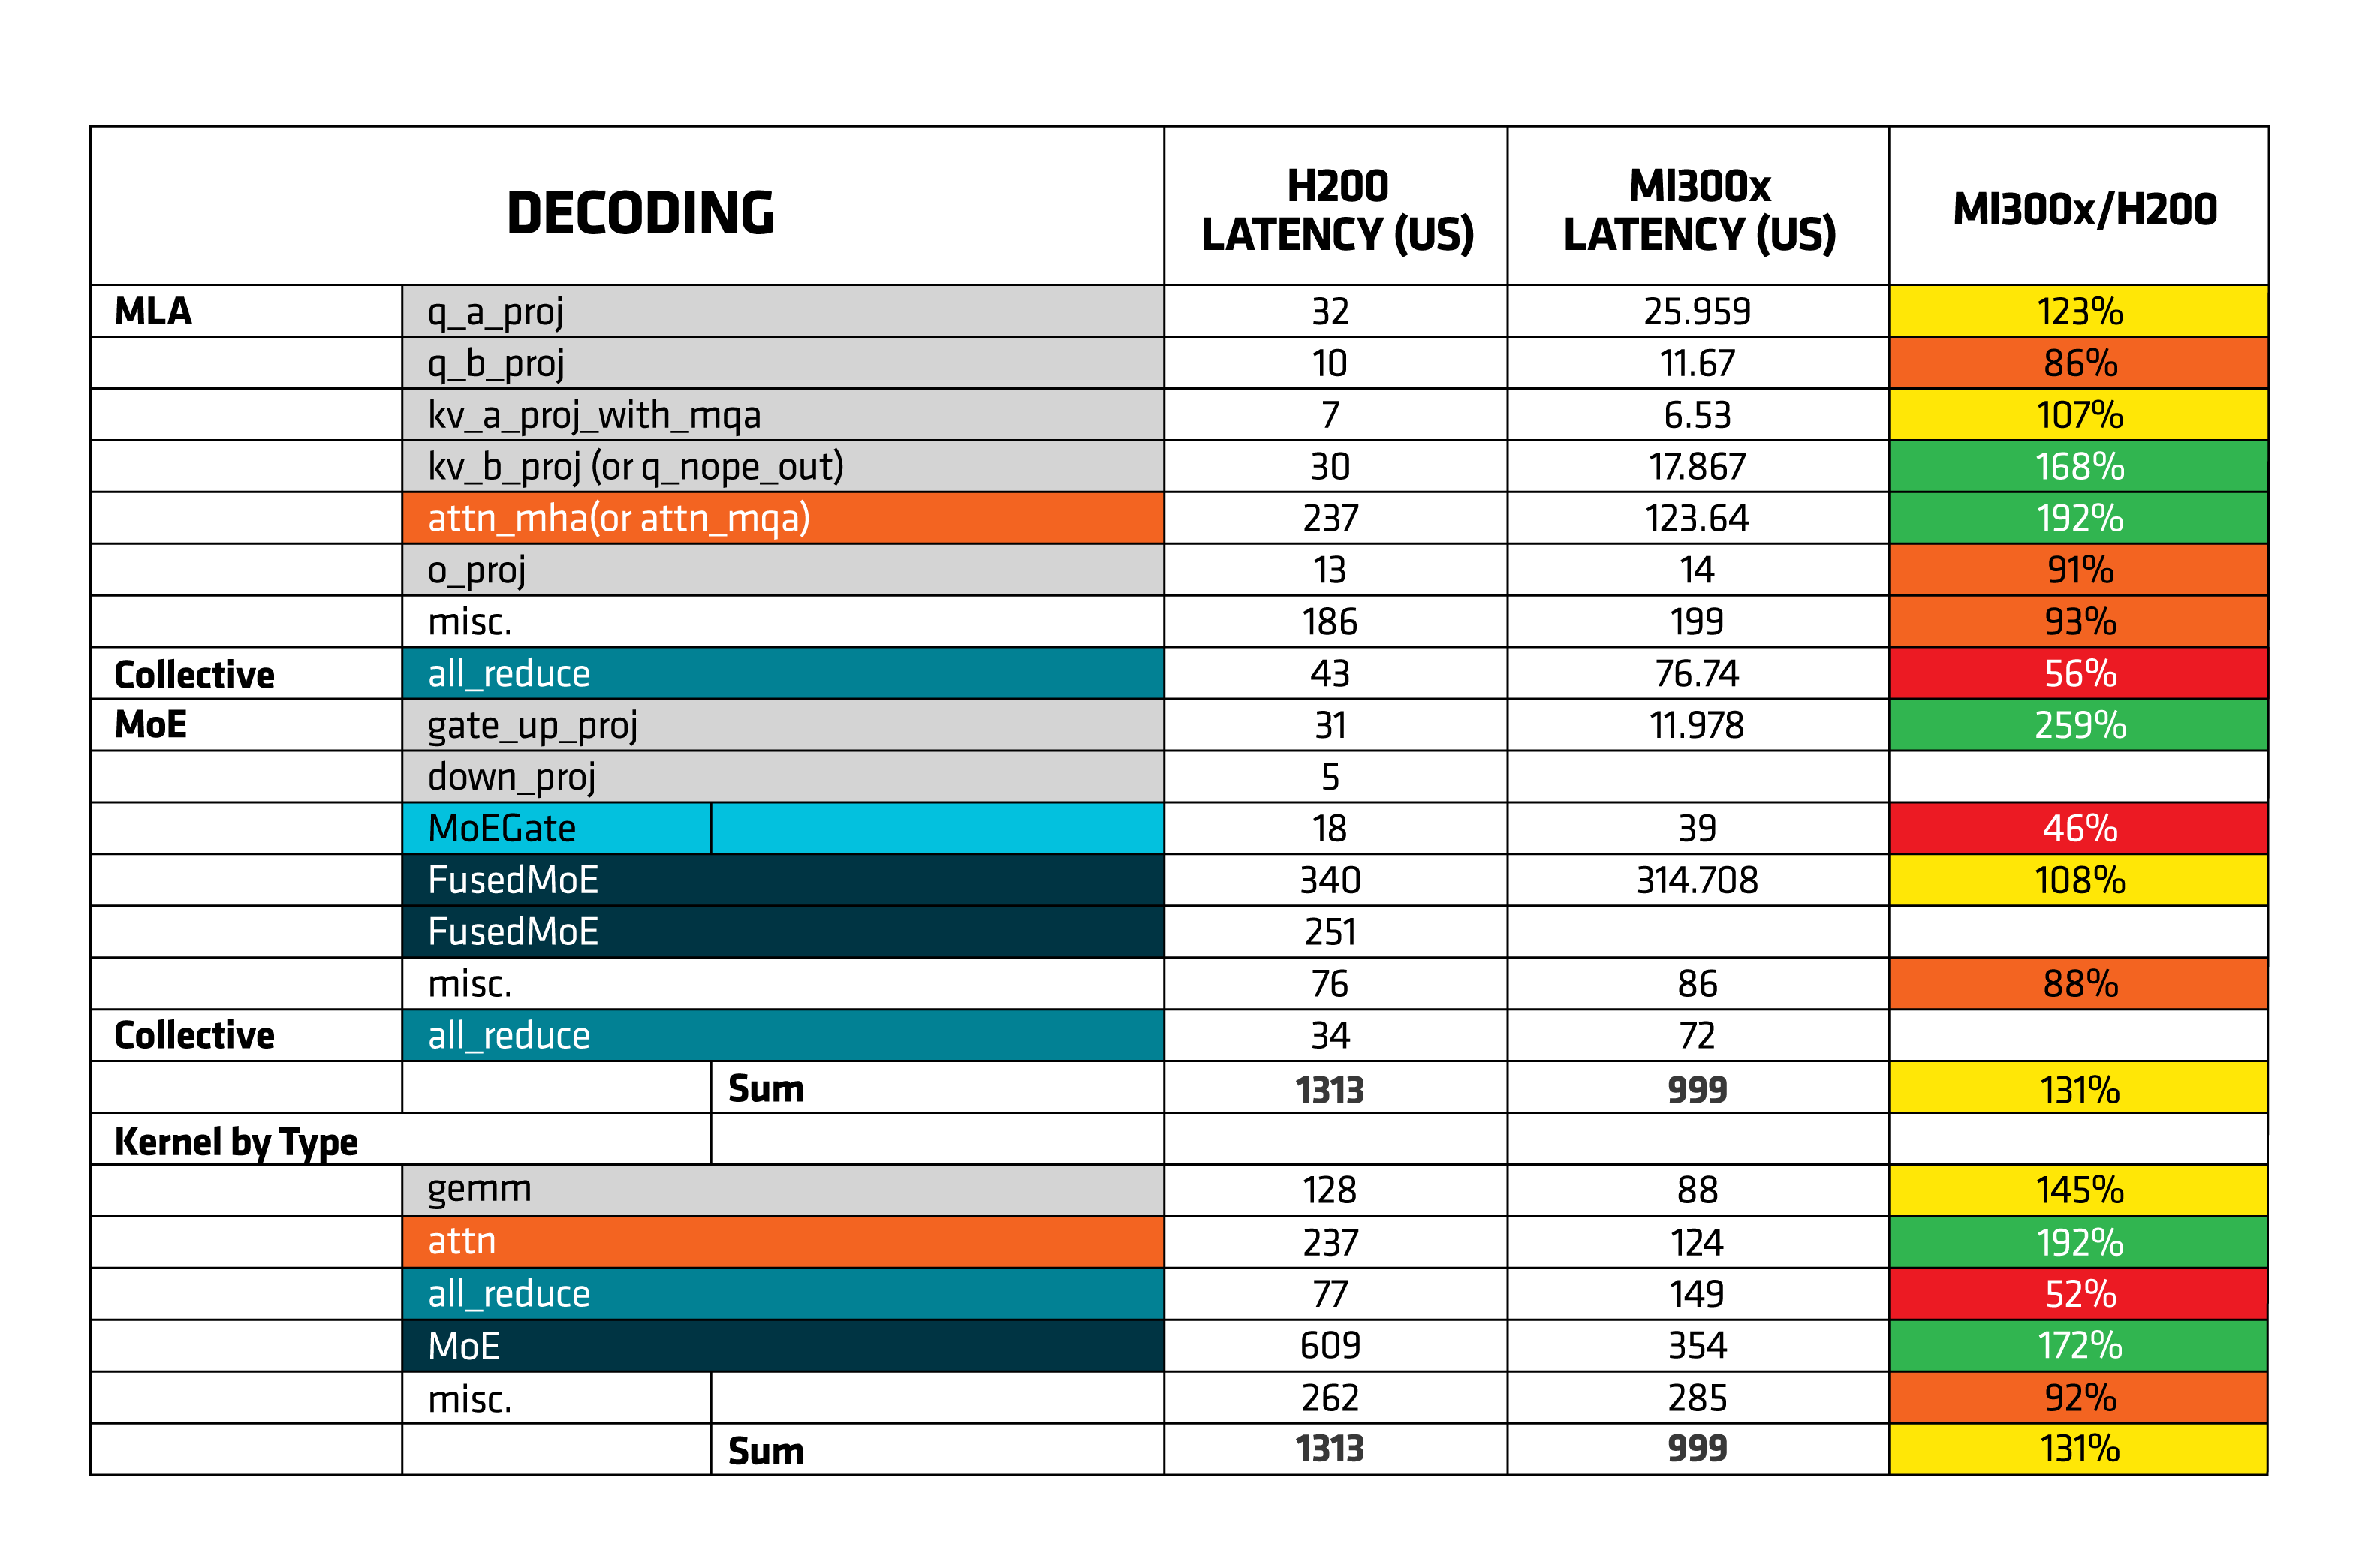
Table 1. Decode Phase Kernel Level Breakdown of Latency of H200 and MI300X.#
The pie chart below (Figure 5) illustrates the distribution of compute time across different components for both Prefill and Decode stages on MI300X GPUs. In the Prefill phase, attention and MoE operations consume the majority of time, with noticeable contributions from GEMM and miscellaneous tasks. In contrast, during the Decode phase, MoE becomes the most dominant, while attention takes a smaller share, and the rest of the time is spread across GEMM, all_reduce, and miscellaneous operations.
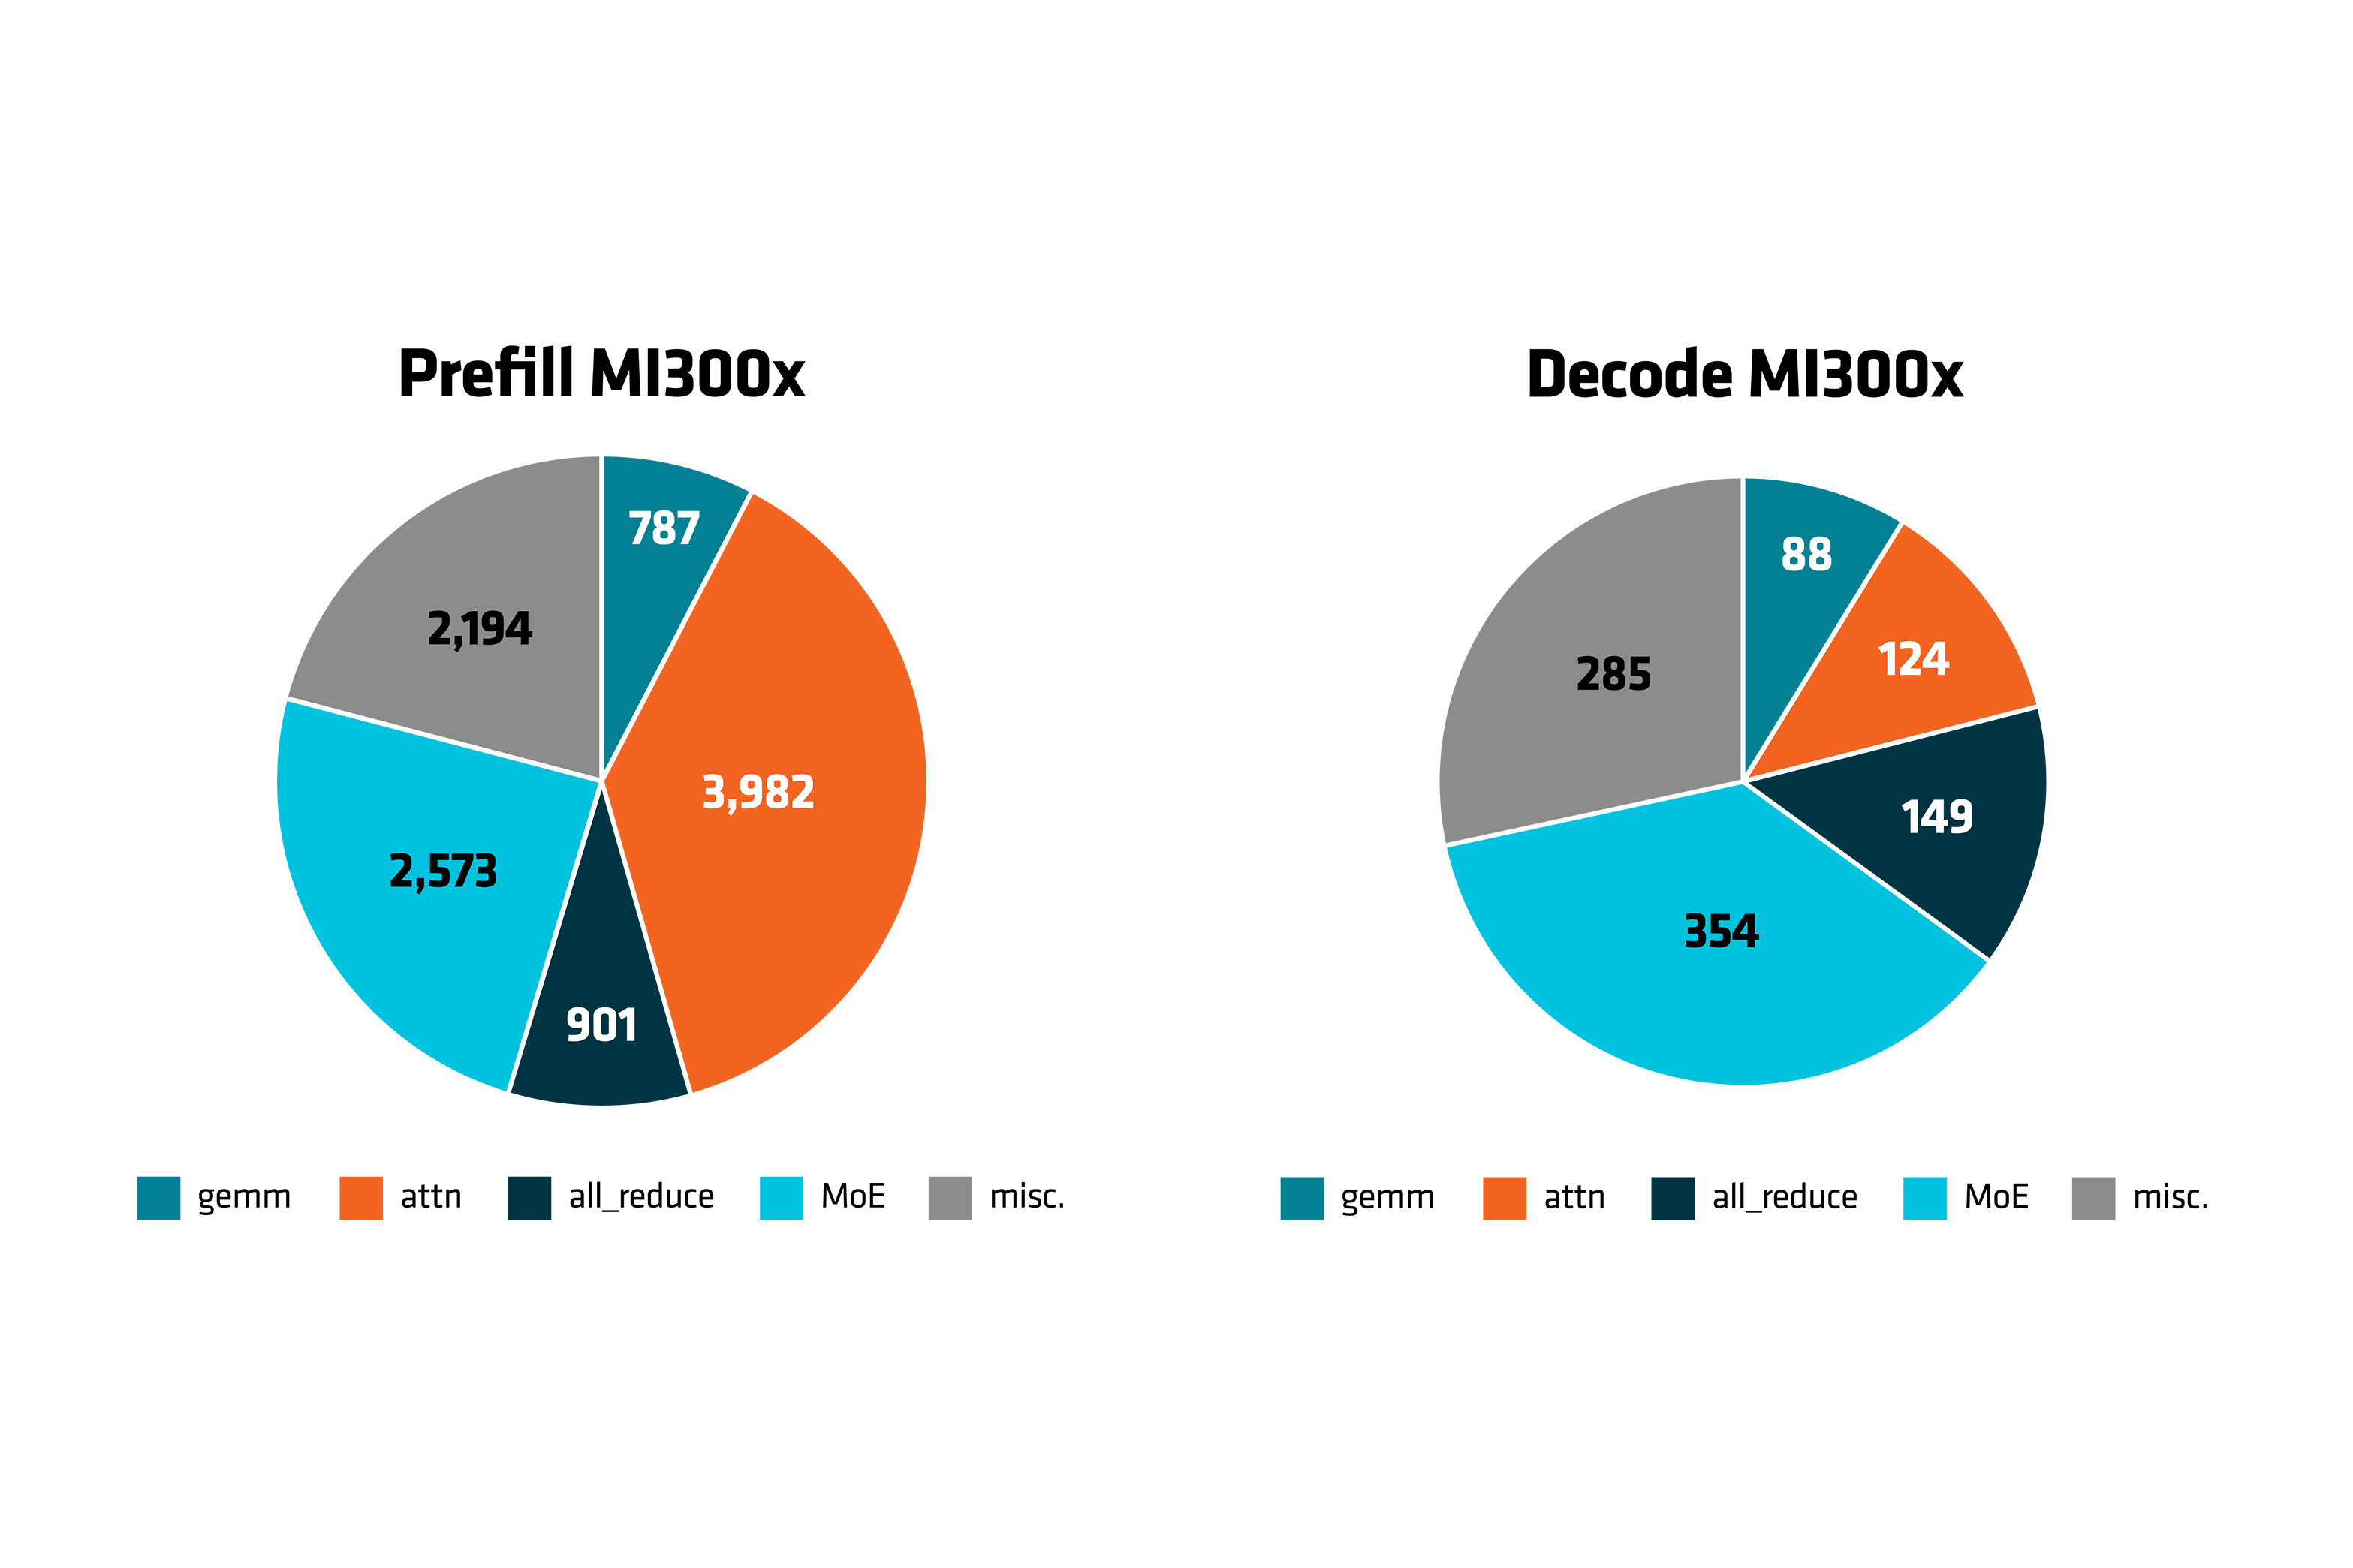
Figure 5. Compute time(seconds) for Prefill and Decode for MI300X GPU#
Summary#
This blog demonstrates how optimizing DeepseekV3 on AMD Instinct™ MI300X GPUs through detailed profiling, architectural understanding, and targeted kernel improvements can unlock significant performance gains. Using tools like RPD and Torch Profiler, we identified key bottlenecks—particularly around memory transfers and kernel inefficiencies—and addressed them through fused operations and kernel updates. These steps not only improved efficiency across both prefill and decode paths but also highlighted the potential of open-source LLMs on AMD hardware. This is just the beginning; stay tuned for our future blogs where we will show you how to further elevate inference performance in production environments.
Reference#
Unlock DeepSeek-R1 Inference Performance on AMD Instinct™ MI300X GPU — ROCm Blogs
[2412.19437] DeepSeek-V3 Technical Report
https://pytorch.org/tutorials/recipes/recipes/profiler_recipe.html
Endnote#
On average, a system configured with an AMD Instinct™ MI300X GPU and
NVIDIA HGX H200 Platform shows that Decode Phase Kernel Level Breakdown
of Latency of H200 and MI300X. Testing done by AMD on 03/17/2025,
results may vary based on configuration, usage, software version, and
optimizations.
SYSTEM CONFIGURATION: AMD Instinct™ MI300X platform\
System Model: Supermicro GPU A+ Server AS - 8125GS-TNMR2\
CPU: 2x AMD EPYC 9654 96-core Processor (2 sockets, 96 cores per socket, 2 threads per core)\
NUMA Config: 2 NUMA node per socket\
Memory: 2.3 TiB (24 DIMMs, 4800 mts, 96 GiB/DIMM)\
Disk: Root drive + Data drive combined:\
2x 960GB Samsung MZ1L2960HCJR-00A07\
4x 3.84TB Samsung MZQL23T8HCLS-00A07\
GPU: 8x AMD MI300X 192GB HBM3 750W\
Host OS: Ubuntu 22.04.4 LTS with Linux kernel 5.15.0-116-generic.\
System BIOS: 3.2
System Bios Vendor: American Megatrends International, LLC.
Host GPU Driver (amdgpu version): 6.10.5
SYSTEM CONFIGURATION:NVIDIA HGX H200 Platform\
System Model: Supermicro SYS-821GE-TNHR\
CPU: 2x Intel Xeon Platinum 8592V 64-Core Processor\
NUMA: 2 NUMA node per socket. NUMA auto-balancing enabled\
Memory: 3072 GiB (32 DIMMs x 96 GiB Micron Technology MTC40F204WS1RC56BB1 DDR5 5600 MT/s)\
Disk: 432TiB (16 x 27TiB SOLIDIGM SBFPF2BU307T)\
GPU: 8x NVIDIA Hopper H200 141GB HBM 700W\
Host OS: Ubuntu 22.04.5\
System BIOS: 2.1\
System Bios Vendor: American Megatrends International, LLC.\
Host GPU Driver: Cuda 12.5
Disclaimers#
Third-party content is licensed to you directly by the third party that owns the content and is not licensed to you by AMD. ALL LINKED THIRD-PARTY CONTENT IS PROVIDED “AS IS” WITHOUT A WARRANTY OF ANY KIND. USE OF SUCH THIRD-PARTY CONTENT IS DONE AT YOUR SOLE DISCRETION AND UNDER NO CIRCUMSTANCES WILL AMD BE LIABLE TO YOU FOR ANY THIRD-PARTY CONTENT. YOU ASSUME ALL RISK AND ARE SOLELY RESPONSIBLE FOR ANY DAMAGES THAT MAY ARISE FROM YOUR USE OF THIRD-PARTY CONTENT.