RDC and RocProfiler Compared to DCGM for Commonly Used Metrics#

Modern GPU applications often need lightweight, repeatable performance checks that can run outside a full profiling session. A developer might want to confirm whether a workload is throttling, whether data is moving across GPU interconnects as expected, whether ECC counters are increasing, or whether the GPU is spending enough time on useful compute work. These checks are especially useful during application tuning, cluster validation, and regression testing.
On AMD GPU platforms, the ROCm Data Center tool (RDC) provides a command-line interface for collecting this type of telemetry. RDC brings together hardware status, reliability data, and runtime profiling metrics so developers and system operators can observe GPU behavior without opening a full profiler interface. This blog introduces commonly used RDC metrics and compares them with similar DCGM metrics used in NVIDIA environments.
The goal is not to provide a one-to-one mapping for every counter. Instead, this post shows how to think about the most common monitoring categories: hardware health, data transport, error monitoring, runtime utilization, occupancy, and data type activity. These categories give developers a practical starting point for evaluating whether an application is using GPU resources effectively.
RDC Overview#
RDC stands for ROCm Data Center tool. It provides GPU information from several ROCm components:
ROCm-SMI reports hardware status, such as temperature, power usage, and clock frequency.
RAS reports reliability, availability, and serviceability information, including error counters for GPU components such as SDMA, GFX, MMHUB, and XGMI.
RocProfiler provides software runtime information, including active cycles, FLOPs, and other performance counters.
Together, these sources make RDC useful for both system-level monitoring and application-level performance triage. For example, if a workload is slower than expected, RDC can help determine whether the problem is related to power throttling, thermal throttling, inter-GPU traffic, ECC errors, or low compute utilization.
How RDC Works#
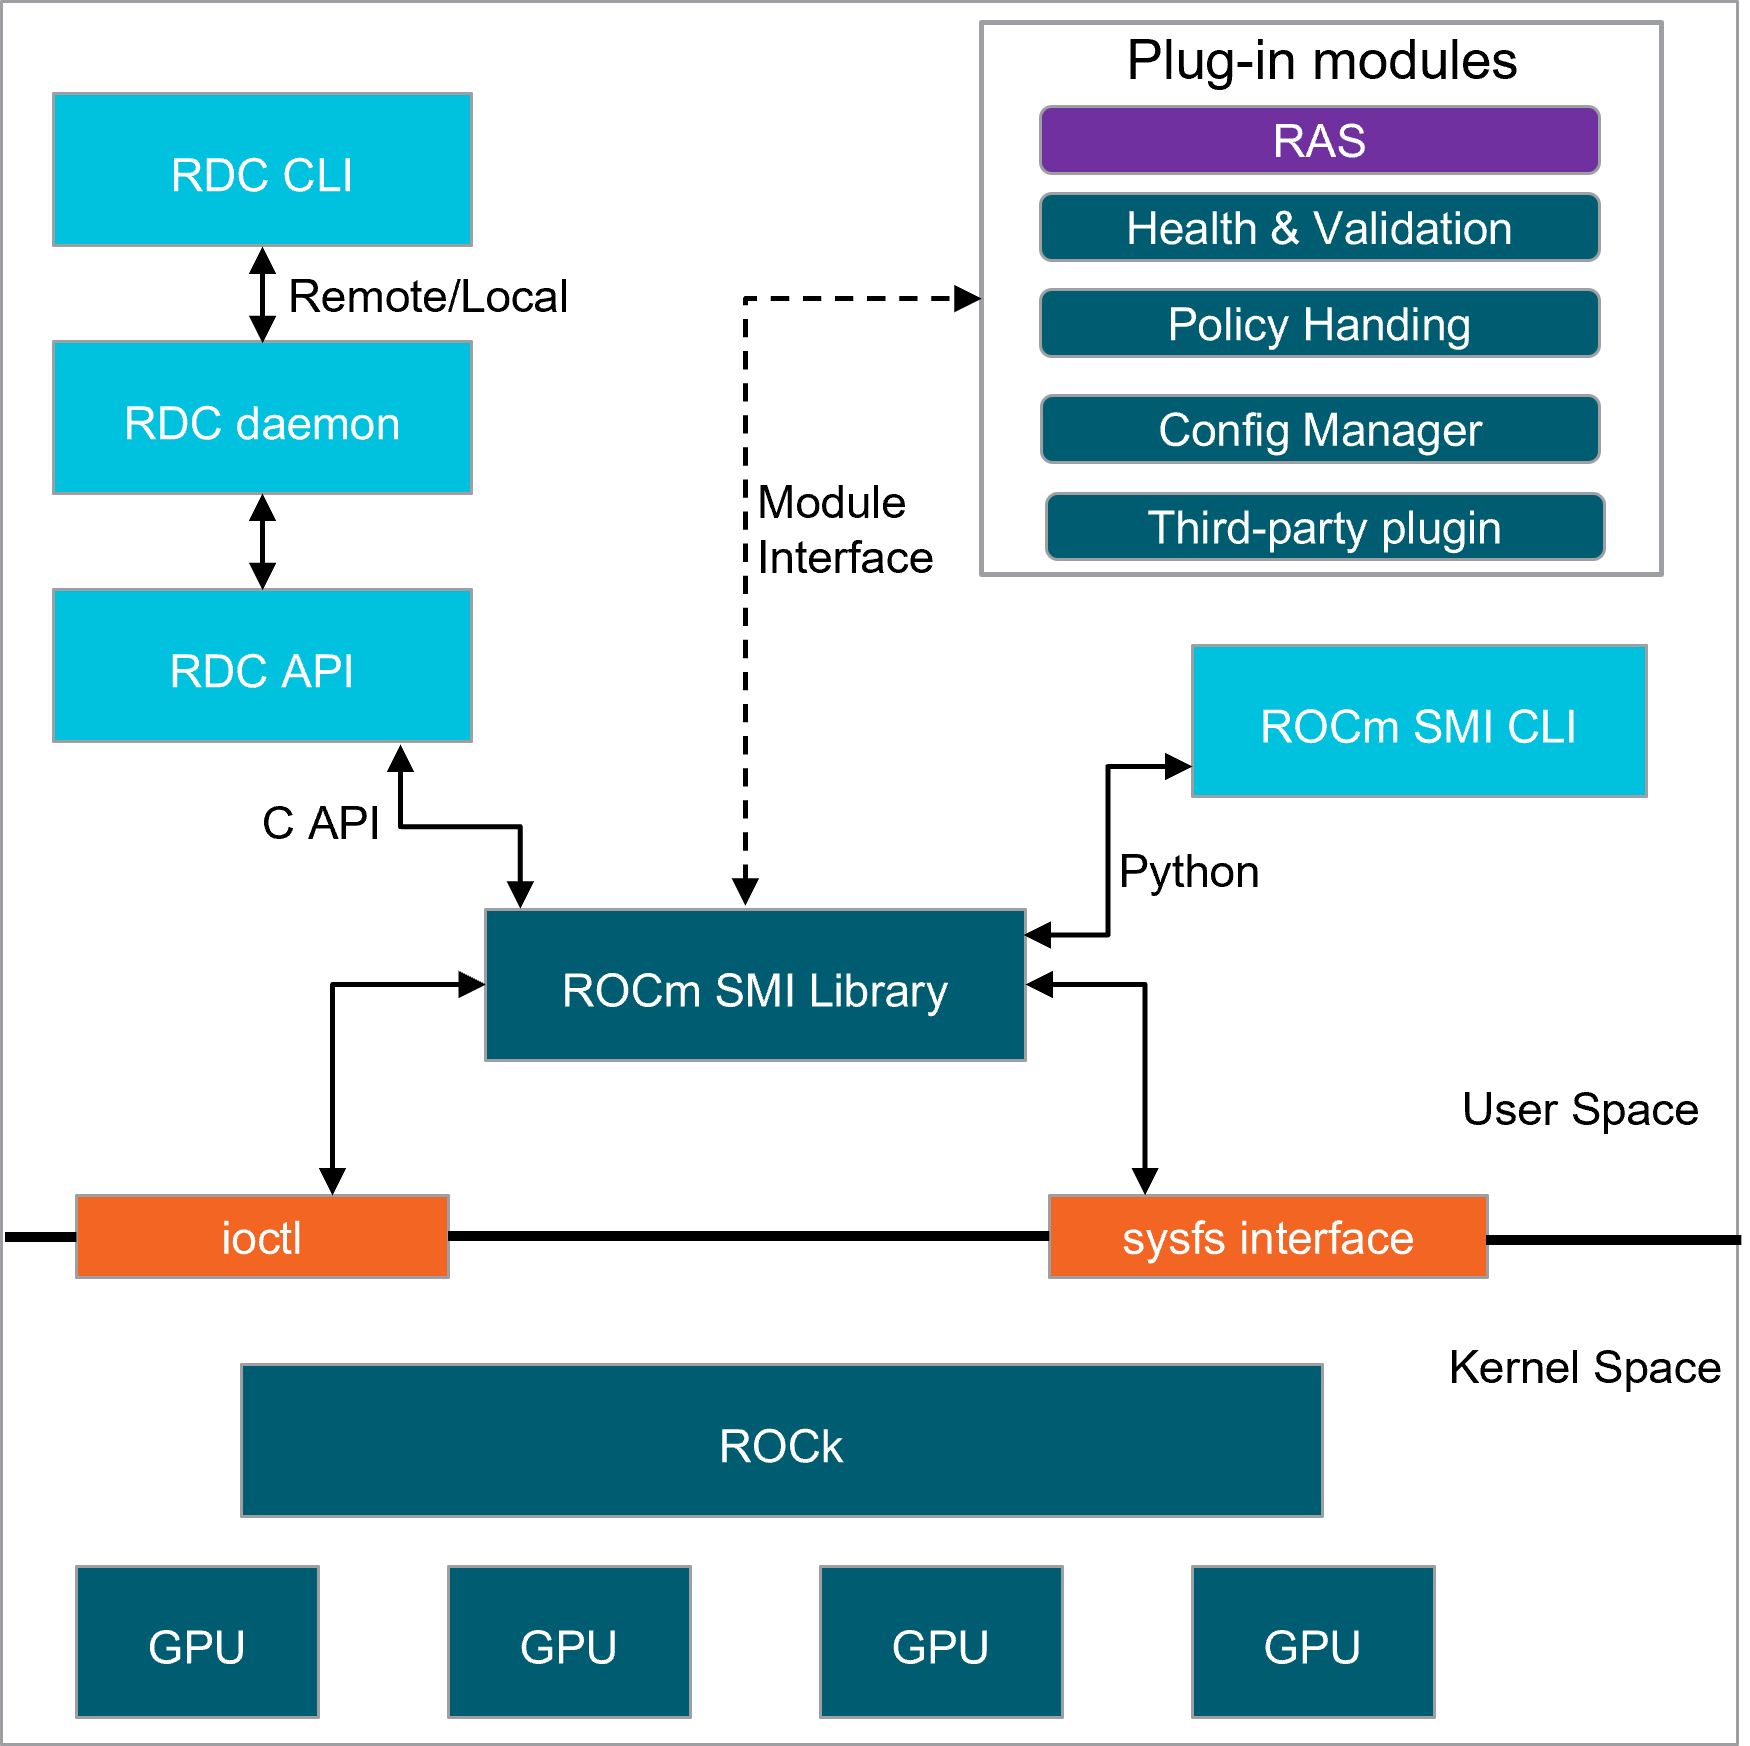
RDC uses two main components: the RDC daemon (rdcd) and the RDC command-line tool (rdci). The daemon records telemetry information from GPUs and exposes an interface that can be queried locally or remotely. The command-line tool connects to the daemon and collects selected metrics.
This architecture allows RDC to be used interactively during development or as part of automated monitoring workflows.
How to Use RDC#
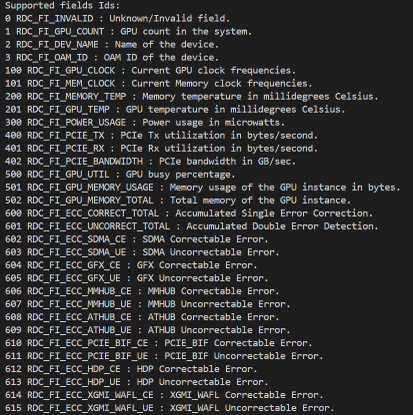
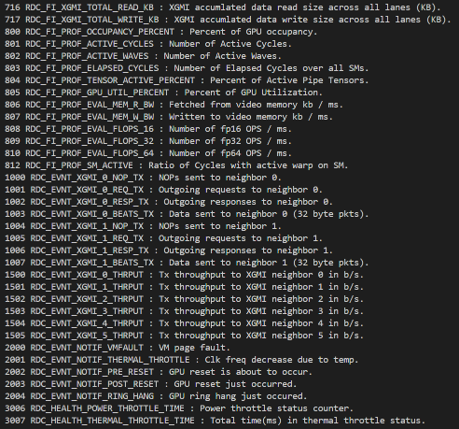
You can list all metrics supported by RDC with the following command:
rdci dmon -u --list-all
The figure below shows an example of listing all the supported metrics.
To start collecting metrics, first start the RDC daemon with rdcd, then use rdci to monitor selected fields:
rdcd -u
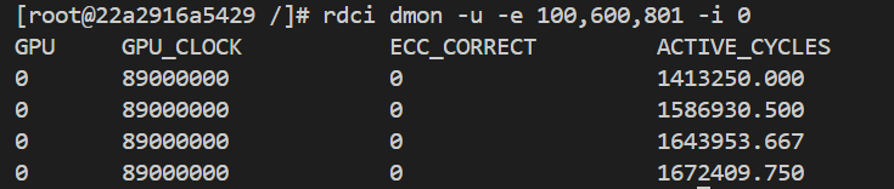
rdci dmon -u -e 100,600,801 -i 0
In this example, -e is followed by a comma-separated list of RDC field IDs:
100maps toGPU_CLOCK, from AMD SMI.600maps toECC_CORRECT, from RAS.801maps toACTIVE_CYCLES, from RocProfiler.
The -i 0 option selects GPU index 0. This makes the command useful for quickly checking one GPU while an application is running.
Commonly Used Metrics in RDC and DCGM#
The following sections group commonly used metrics into practical monitoring categories. For each category, RDC fields are shown alongside comparable DCGM fields. These comparisons are intended to help developers who are familiar with DCGM understand which RDC fields provide similar visibility on AMD GPU platforms.
Hardware Metrics#
Hardware metrics are often the first place to look when GPU performance is lower than expected. Clock frequency, throttling state, power behavior, and interconnect traffic can all explain performance variation before a deeper runtime profile is needed.
Throttling#
Thermal and power throttling are common causes of reduced GPU performance. In severe cases, they can also indicate system-level cooling or power delivery problems. If GPU clocks are lower than expected, checking throttle counters is a good first step.
RDC provides the following fields:
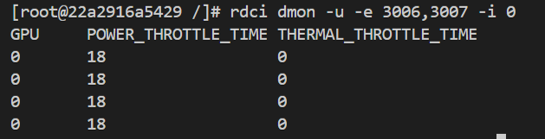
RDC_HEALTH_POWER_THROTTLE_TIMERDC_HEALTH_THERMAL_THROTTLE_TIME
You can monitor these fields with:
rdci dmon -u -e 3006,3007 -i 0
RDC_HEALTH_POWER_THROTTLE_TIME reports the power throttle status counter. RDC_HEALTH_THERMAL_THROTTLE_TIME reports the total time, in milliseconds, that the GPU has spent in a thermal throttle state.
Comparable DCGM fields include:
240,PVIOL, for power violation.241,TVIOL, for thermal violation.
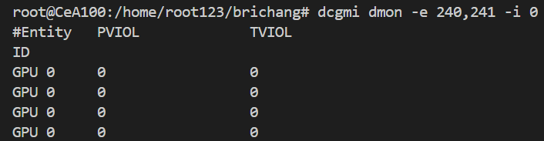
When these counters increase during workload execution, the application may not be limited by kernel efficiency alone. The system could be reducing frequency due to power or temperature limits, which should be addressed before spending time on deeper kernel tuning.
Data Transport#
Multi-GPU applications often depend on fast data movement between GPUs. On AMD GPU systems, XGMI provides high-speed GPU-to-GPU transport. If a multi-GPU workload is performing below expectation, checking XGMI traffic is a useful starting point.
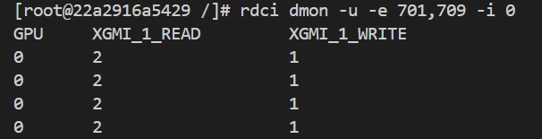
RDC exposes XGMI read and write counters such as:
rdci dmon -u -e 701,709 -i 0
The fields in this example are:
RDC_FI_XGMI_1_READ_KB: accumulated XGMI read traffic in KB.RDC_FI_XGMI_1_WRITE_KB: accumulated XGMI write traffic in KB.
Comparable DCGM fields include:
1011,NVLTX, for NVLink transmit bytes.1012,NVLRX, for NVLink receive bytes.
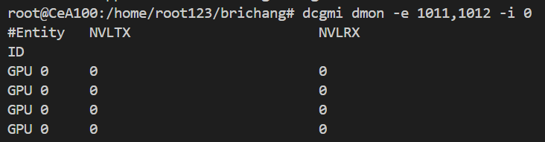
These counters are especially useful when validating distributed workloads, collective communication, tensor-parallel inference, or any application that depends on frequent peer-to-peer GPU transfers.
Error Monitoring#
Performance analysis should also include reliability checks. Error counters help distinguish application tuning issues from hardware or interconnect issues. For long-running workloads, monitoring error fields can help detect problems early and provide better evidence when debugging.
ECC#
AMD GPUs include multiple hardware components, and RDC uses RAS data to expose error information for those components. ECC counters can report both the location of an error and its severity, such as correctable or uncorrectable errors.
You can monitor ECC-related RDC fields with:
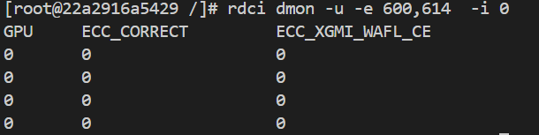
rdci dmon -u -e 600,614 -i 0
The fields in this example are:
RDC_FI_ECC_CORRECT_TOTAL: accumulated correctable ECC errors.RDC_FI_ECC_XGMI_WAFL_CE: XGMI WAFL correctable errors.
Comparable DCGM fields include:
300,ECCUR, for ECC error reporting.788,SWLNKEC, for NVSwitch link ECC errors.
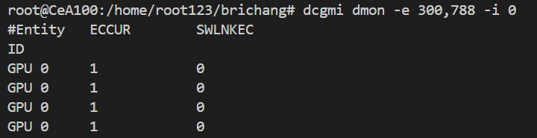
Correctable errors do not always indicate an immediate failure, but a counter that increases repeatedly during a workload should be investigated. Uncorrectable errors should be treated more seriously because they can affect application correctness or system stability.
AMD GPU Component Overview#
RDC RAS metrics may refer to specific GPU components. The following overview provides a short description of common component names:
ATHUB: Address Translation Hub, which translates virtual memory addresses to physical addresses.SDMA: System Direct Memory Access, a hardware block that enables efficient data transfer between the system and GPU without direct CPU involvement.MMHUB: Memory Management Hub, which handles memory requests.GFX: Graphics and compute processing hardware.PCIE_BIF: PCIe Bus Interface, which manages PCIe system access and data paths.XGMI_WAFL: A component related to data transfer between GPUs.MP0: Power management processor.MP1: Firmware component related to power and performance management.UMC: Unified Memory Controller, which dispatches read and write requests.VCN: Video Core Next, a component for video encode and decode.HDP: Host Data Path, which manages data transfer between the host system and GPU.SMN: System Management Network, a parallel interface mechanism used for fast register access.MPIO: Multi-Path Input/Output.
Knowing these component names makes error output easier to interpret. Instead of seeing an ECC counter as a single generic signal, developers can identify which part of the GPU or interconnect path needs attention.
Understanding AMD GPU Structure#
To interpret performance metrics correctly, it helps to understand the hierarchy of an AMD GPU. The following example uses MI308.
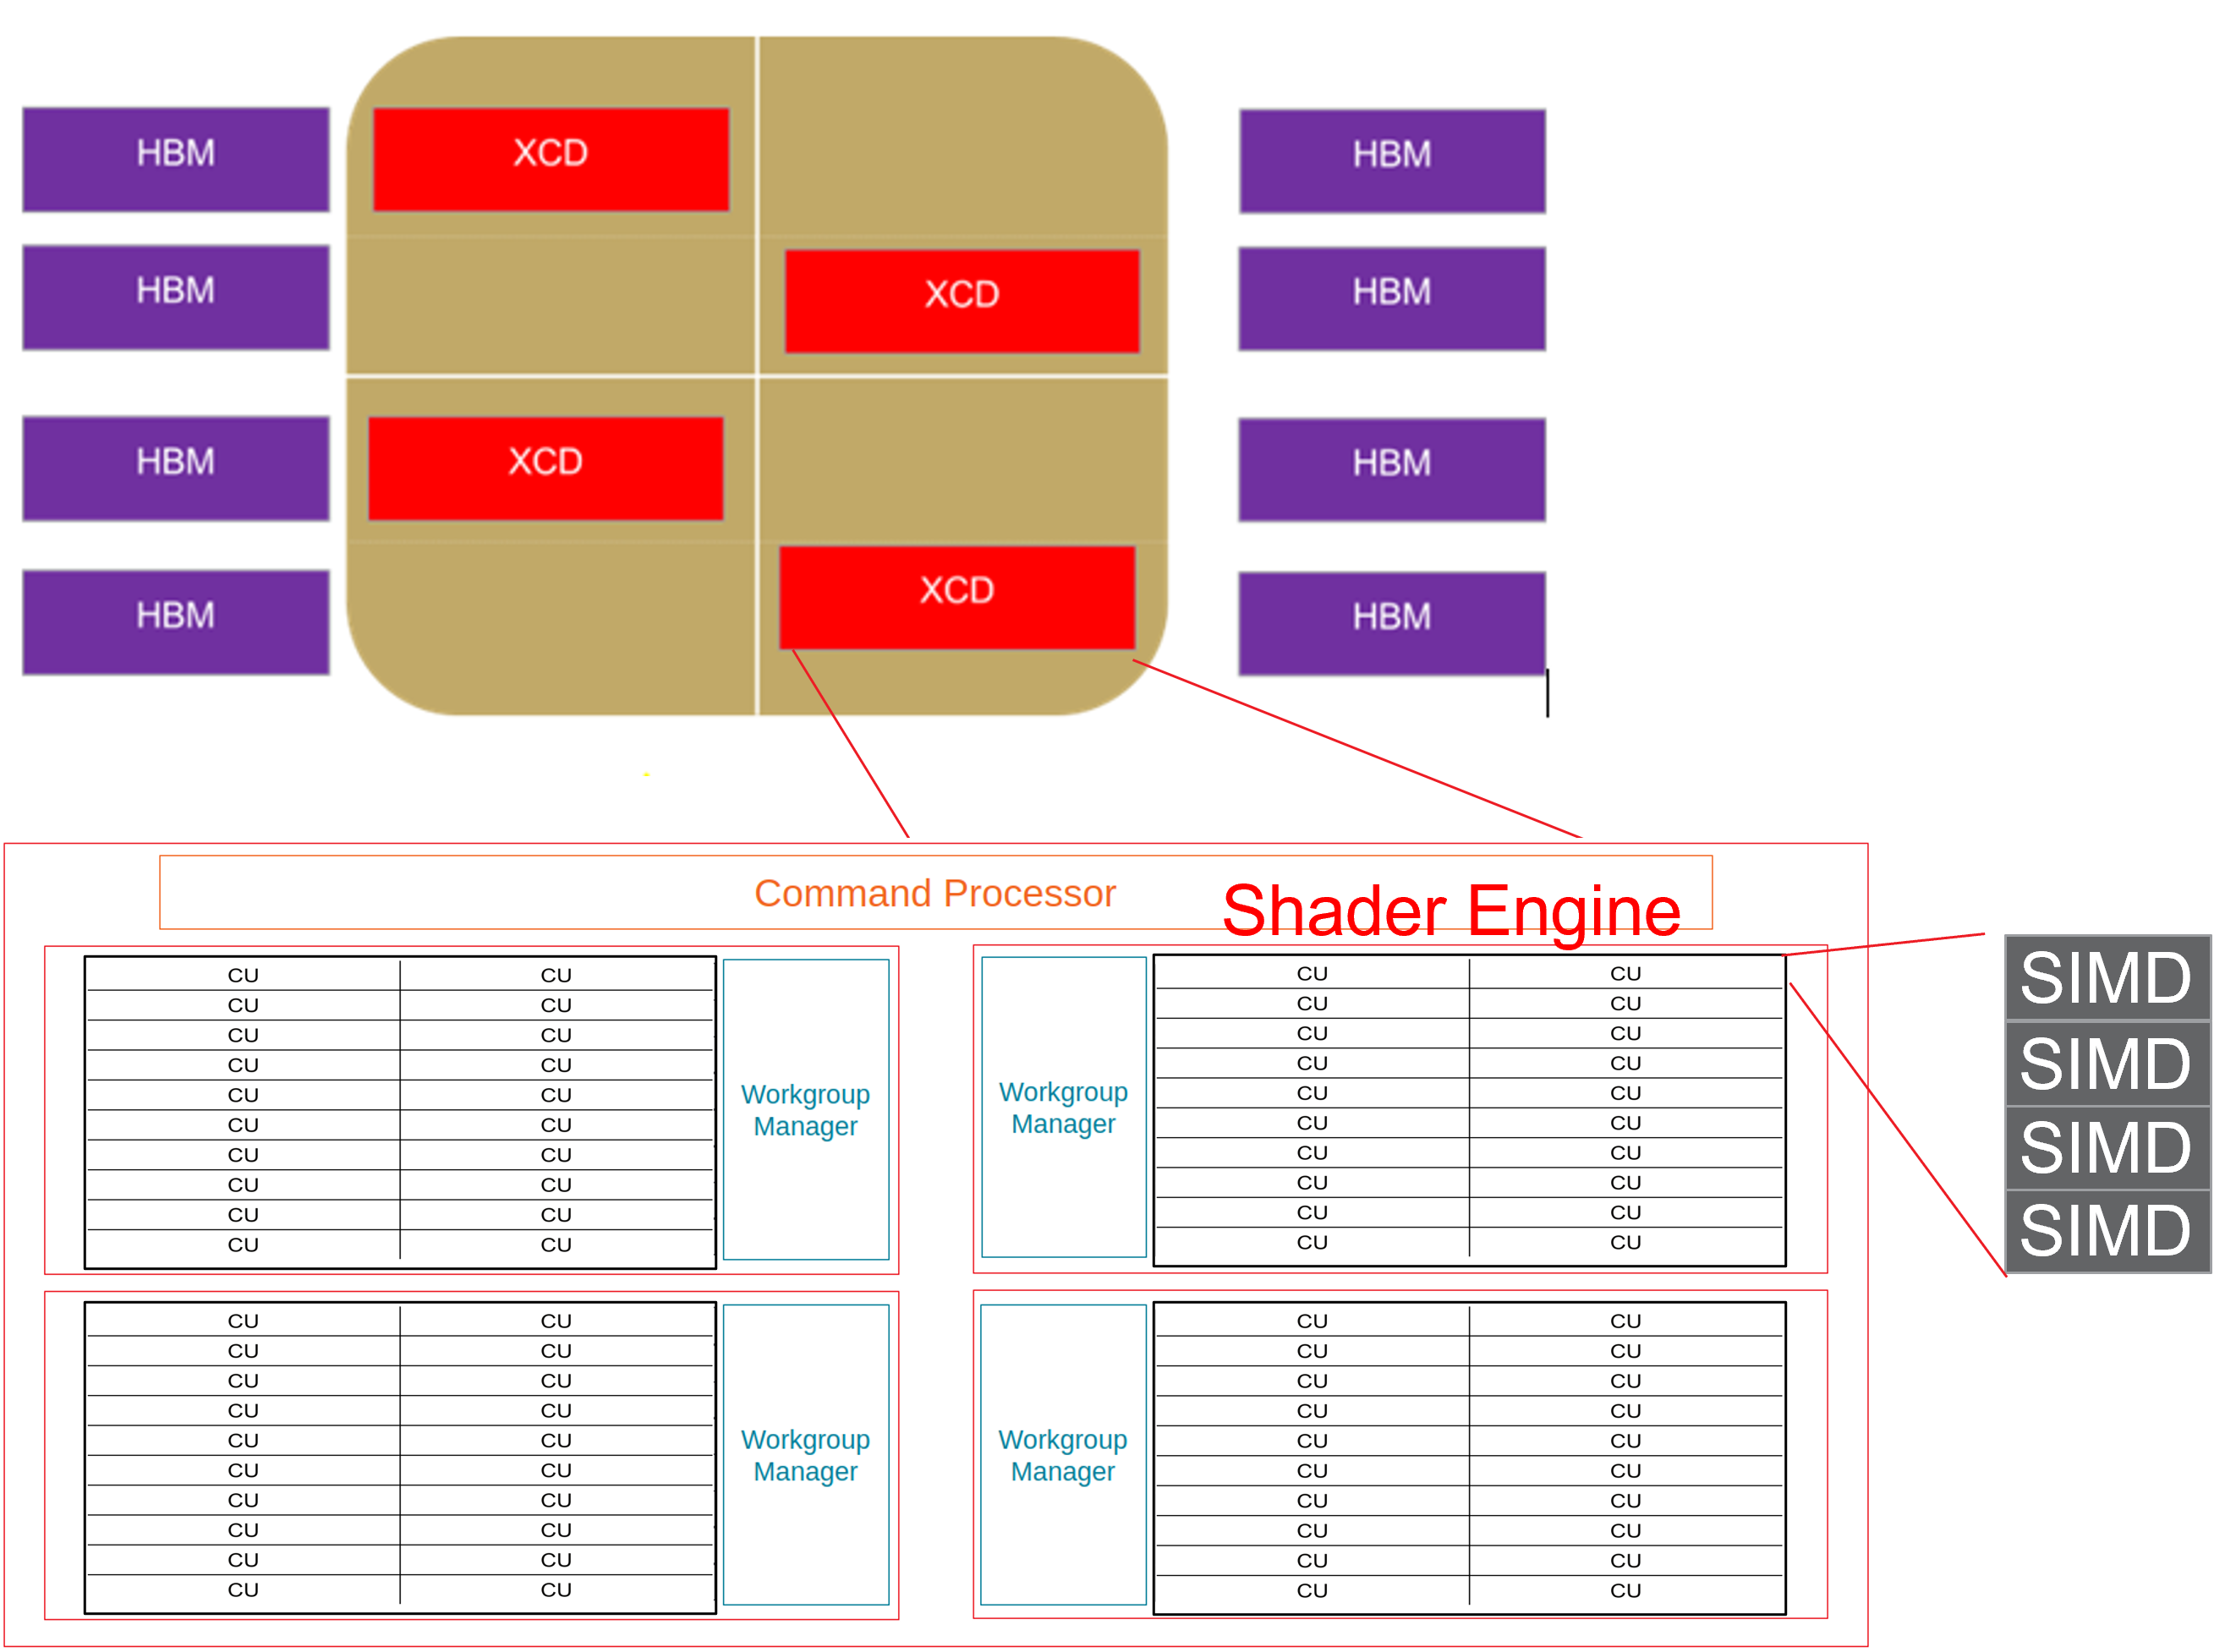
In this example:
One MI308 has 4 XCDs.
Each XCD has 1 XCC.
Each XCC has 4 shader engines, or SEs.
Each SE has 5 compute units, or CUs.
Each CU has 4 SIMDs.
Each SIMD has 64 lanes.
Therefore, the MI308 has a total of 4 × 1 x 4 × 5 × 4 = 320 SIMD units.
This hierarchy matters because different metrics describe activity at different levels. Some counters describe SIMD-level utilization, others describe CU-level activity, and others describe wave occupancy.
RocProfiler Runtime Metrics#
Hardware telemetry is useful, but it does not fully describe how efficiently an application is using the GPU. Runtime profiling metrics help answer questions such as:
Are compute units active?
Are vector ALUs being used efficiently?
Is the application limited by occupancy, memory, or instruction mix?
Which data types are active during execution?
RDC exposes selected RocProfiler metrics so developers can inspect runtime behavior through the same command-line workflow used for system monitoring.
VALUBusy, GPU Utilization, and Tensor Activity#
The following RDC fields provide a high-level view of compute activity:
VALUBusy: percentage of cycles in which waves are issuing work to VALU units.GPU_UTIL_PERCENT: percentage of time that any GPU component is active.TENSOR_PERCENT: percentage of time that tensor or matrix units are active.
You can collect these fields with:
rdci dmon -u -e 812,805,804 -i 0
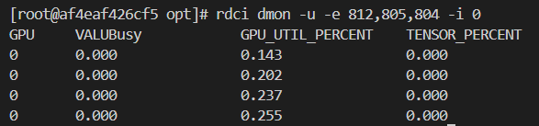
Comparable DCGM fields include:
1002,SMACT, forDCGM_FI_PROF_SM_ACTIVE.1003,SMOCC, forDCGM_FI_PROF_SM_OCCUPANCY.1004,TENSO, forDCGM_FI_PROF_PIPE_TENSOR_ACTIVE.
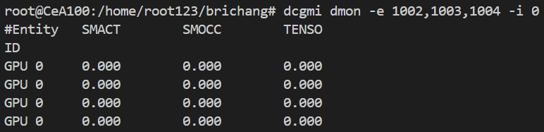
These metrics are useful for a quick first look. For example, high GPU utilization with low tensor activity may indicate that the workload is active but not using matrix instructions heavily. Low VALUBusy may indicate that vector ALUs are underused, even if the GPU is not idle.
VALUBusy Example#
The following example issues many f32 additions in sequence. It is designed to create vector ALU work and make the relationship between launch configuration and VALUBusy easier to observe.
#include <hip/hip_runtime.h>
#include <iostream>

__global__ void mat_kernel2()
{
    for (int i = 0; i < 1024 * 32; i++)
    {
        asm volatile("v_add_f32 v0, v1, v0");
        asm volatile("v_add_f32 v2, v3, v2");
        asm volatile("v_add_f32 v4, v5, v4");
    }
}

int main()
{
    for (int i = 0; i <= 10000; i++)
        hipLaunchKernelGGL(mat_kernel2, 80, 16, 0, 0);
    hipDeviceSynchronize();
    return 0;
}
Compile and run the example with:
hipcc example.cpp
./a.out
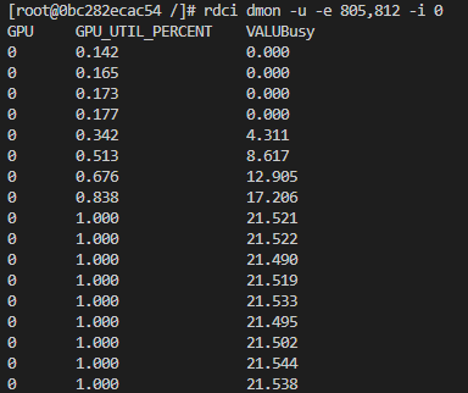
VALUBusy is defined as:
name = "VALUBusy"
expr = 100 * reduce(SQ_ACTIVE_INST_VALU, sum) * 4 / SIMD_NUM / reduce(GRBM_GUI_ACTIVE, sum)
descr = "The percentage of GPU time during which vector ALU instructions are processed.
         Value range: 0% (bad) to 100% (optimal)."
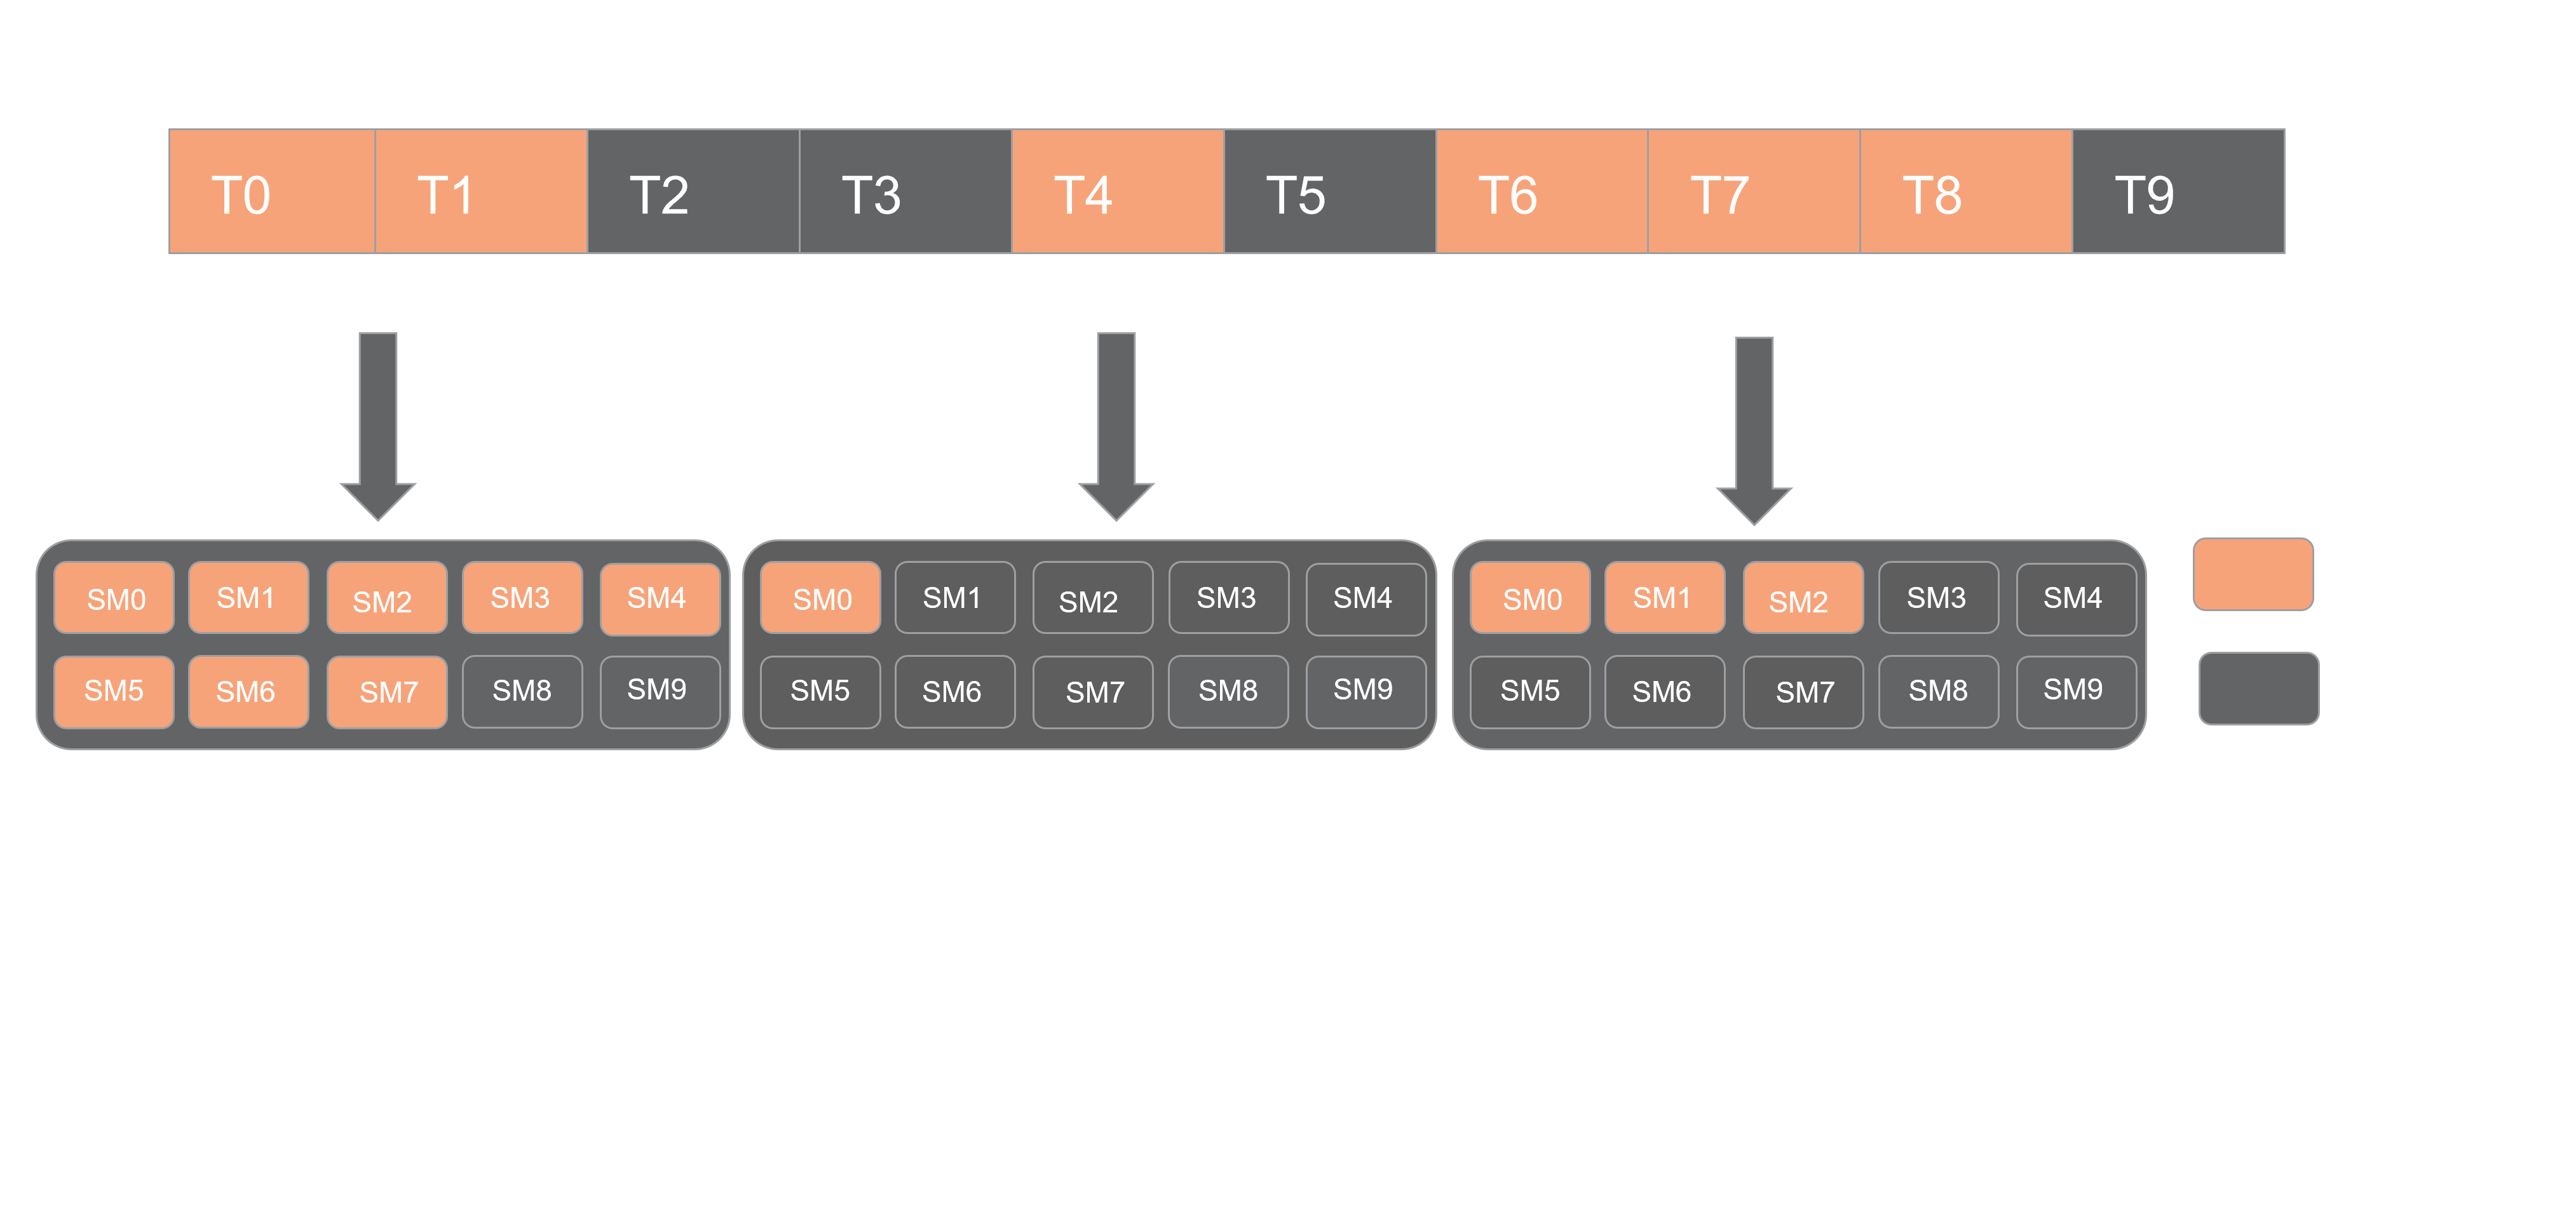
In this example, VALUBusy is around 21%. If the launch block count is increased to 160, or if the thread count is increased beyond 64, VALUBusy increases to around 43%.
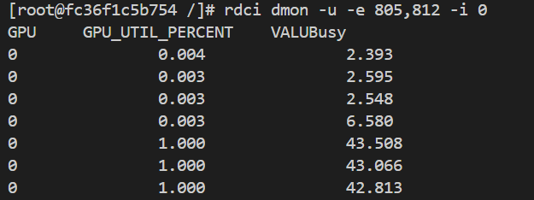
hipLaunchKernelGGL(mat_kernel2, 160, 64, 0, 0);
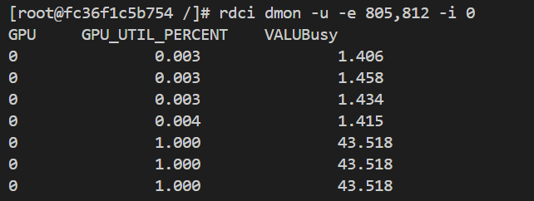
hipLaunchKernelGGL(mat_kernel2, 80, 65, 0, 0);
This behavior comes from how VALUBusy measures vector ALU activity. The metric reflects how much VALU work the SIMDs are issuing. In this case, the GPU has 80 CUs, and each CU has 4 SIMDs with 64 lanes. Launching 80 blocks with 65 threads can produce a similar VALUBusy result to launching 160 blocks with 64 threads, because both configurations increase SIMD-level activity compared with the initial launch.
The simplified diagram below illustrates the relationship between the launch configuration and VALUBusy.
OCCUPANCY_PERCENT Versus VALUBusy#
In some workloads, OCCUPANCY_PERCENT can be high while VALUBusy remains low. This usually means the GPU has many active waves, but those waves are not issuing enough vector ALU work. The application may be waiting on memory, using instructions that do not stress VALU units, or limited by another resource.
The following diagram shows the structure of an AMD GPU compute unit.
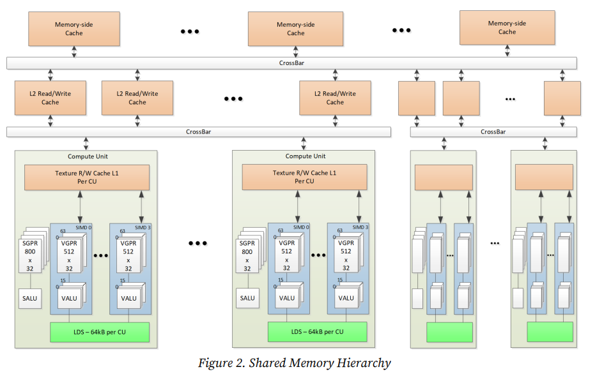
Each compute unit has local data share (LDS), which is shared memory available to workgroups running on the CU. In this example, each CU has 64 KB of LDS. If a kernel uses a large amount of LDS per workgroup, fewer workgroups can be resident at the same time, which can reduce occupancy. If the kernel uses less LDS, occupancy can be higher, but that does not automatically guarantee high VALUBusy.
The following kernel uses static shared memory to show how LDS usage can affect occupancy.
#include <hip/hip_runtime.h>
#include <iostream>
// Kernel using static shared memory
__global__ void occ_kernel_static_shared(float* output) {
    __shared__ float shared_mem[57344 / sizeof(float)];  // Static shared memory (64KB)
    //__host__ float shared_mem[35536 / sizeof(float)];
    int idx = threadIdx.x + blockIdx.x * blockDim.x;
    // Fill shared memory
    shared_mem[threadIdx.x] = static_cast<float>(idx);
    // Simulate computation
    for (int i = 0; i < 4096; i++) {
        shared_mem[threadIdx.x] += 1.0f;
    }
    // Write result to global memory
    output[idx] = shared_mem[threadIdx.x];
}
int main() {
    const int grid_size = 80*8*4;                // Number of blocks (matches CU count)
    const int block_size = 64;             // Number of threads per block
    const int num_elements = grid_size * block_size;
    // Allocate device memory
    float* d_output;
    hipMalloc(&d_output, num_elements * sizeof(float));
    for(int i=0;i<=10000000;i++)
    hipLaunchKernelGGL(occ_kernel_static_shared, dim3(grid_size), dim3(block_size), 0, 0, d_output);
    // Synchronize
    hipDeviceSynchronize();
    // Free device memory
    hipFree(d_output);
    std::cout << "Kernel execution completed with static shared memory." << std::endl;
    return 0;
}
The following code uses host memory instead of shared memory (LDS).
#include <hip/hip_runtime.h>
#include <iostream>
// Kernel using static shared memory
__global__ void occ_kernel_static_shared(float* output) {
  //__shared__ float shared_mem[57344 / sizeof(float)];  // Static shared memory (64KB)
    __host__ float shared_mem[35536 / sizeof(float)];
    int idx = threadIdx.x + blockIdx.x * blockDim.x;
    // Fill shared memory
    shared_mem[threadIdx.x] = static_cast<float>(idx);
    // Simulate computation
    for (int i = 0; i < 4096; i++) {
        shared_mem[threadIdx.x] += 1.0f;
    }
    // Write result to global memory
    output[idx] = shared_mem[threadIdx.x];
}
int main() {
    const int grid_size = 80*8*4;                // Number of blocks (matches CU count)
    const int block_size = 64;             // Number of threads per block
    const int num_elements = grid_size * block_size;
    // Allocate device memory
    float* d_output;
    hipMalloc(&d_output, num_elements * sizeof(float));
    for(int i=0;i<=10000000;i++)
    hipLaunchKernelGGL(occ_kernel_static_shared, dim3(grid_size), dim3(block_size), 0, 0, d_output);
    // Synchronize
    hipDeviceSynchronize();
    // Free device memory
    hipFree(d_output);
    std::cout << "Kernel execution completed with host memory." << std::endl;
    return 0;
}
Compile the test with optimization disabled so the compiler does not remove or simplify the intended behavior:
hipcc test_occupancy.cpp -O0 -o test_occupancy.out
The result shows how occupancy changes between the two cases.
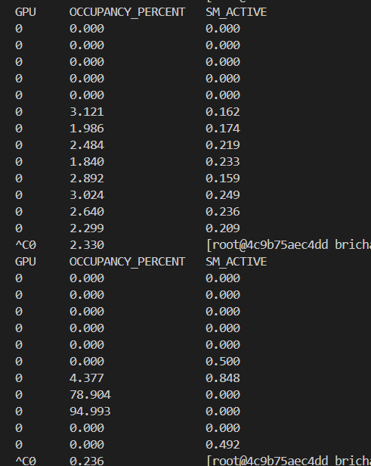
In this result, the top run (with LDS) shows lower occupancy. This is because LDS capacity limits the number of resident workgroups per CU, reducing occupancy.
Data Type Metrics#
In addition to utilization and occupancy metrics, RDC can report activity for different floating-point data types. These metrics are useful when validating whether an application is using the expected precision mode. For example, an inference workload expected to use FP16 or BF16 should show activity in the corresponding lower-precision paths rather than only FP32.
RDC provides both raw instruction counts and percentage-style metrics for data type activity. The following command collects FP16, FP32, and FP64 evaluation FLOPs fields:
rdci dmon -u -e 808,809,810 -i 0
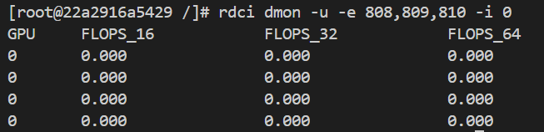
The fields in this example are:
RDC_FI_PROF_EVAL_FLOPS_16: number of FP16 operations per millisecond.RDC_FI_PROF_EVAL_FLOPS_32: number of FP32 operations per millisecond.RDC_FI_PROF_EVAL_FLOPS_64: number of FP64 operations per millisecond.
Comparable DCGM fields include:
1006,FP64A, for FP64 active.1007,FP32A, for FP32 active.1008,FP16A, for FP16 active.
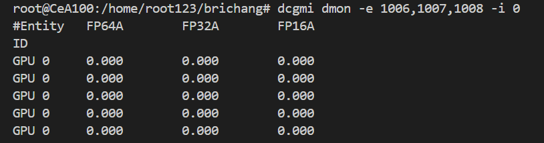
These counters can help confirm whether the application is executing the intended instruction mix. They are also useful when comparing different model configurations, compiler options, or kernel implementations.
Summary#
In this blog, you explored how RDC and RocProfiler can help monitor, diagnose, and optimize AMD GPU workloads using metrics similar to those commonly collected with DCGM. You saw how RDC combines ROCm-SMI, RAS, and RocProfiler data into a command-line workflow for checking GPU health, data transport, ECC reliability, throttling behavior, utilization, occupancy, and data type activity. You also learned how to interpret these metrics as a first layer of performance triage. RDC can quickly show whether a system is healthy, whether a workload is active, and where deeper profiling with RocProfiler may be useful for kernel-level analysis. These monitoring and profiling concepts can serve as a foundation for future investigations into workload behavior on AMD platforms, including dashboard integration, continuous monitoring, and more detailed correlation between RDC metrics and RocProfiler analysis.
Disclaimers#
Third-party content is licensed to you directly by the third party that owns the content and is not licensed to you by AMD. ALL LINKED THIRD-PARTY CONTENT IS PROVIDED “AS IS” WITHOUT A WARRANTY OF ANY KIND. USE OF SUCH THIRD-PARTY CONTENT IS DONE AT YOUR SOLE DISCRETION AND UNDER NO CIRCUMSTANCES WILL AMD BE LIABLE TO YOU FOR ANY THIRD-PARTY CONTENT. YOU ASSUME ALL RISK AND ARE SOLELY RESPONSIBLE FOR ANY DAMAGES THAT MAY ARISE FROM YOUR USE OF THIRD-PARTY CONTENT.