AI Inference Orchestration with Kubernetes on Instinct MI300X, Part 3#

Welcome back to the final part of our series! So far, we’ve successfully setup up a Kubernetes cluster and installed the AMD GPU Operator to seamlessly integrate AMD hardware with Kubernetes in Part 1. We’ve deployed vLLM on AMD Instinct MI300X GPUs, exposed it using MetalLB, and scaled it efficiently in Part 2.
Building on the groundwork from Parts 1 and 2, this blog will help you implement advanced tools to monitor GPU performance, visualize metrics, and provide a user-friendly interface for interacting with your large language models (LLMs). By the end of this final blog in our series, your deployment will be equipped with end-to-end observability and accessibility, ensuring a robust and scalable production environment.
Prerequisites#
Before proceeding, ensure that:
Metrics collection and visualization#
Our next step is implementing comprehensive monitoring for our GPU-accelerated workloads. AMD’s GPU Operator utilizes the AMD Device Metrics Exporter. We’ll use Prometheus to collect metrics from the Exporter and Grafana to visualize them, providing insights into GPU utilization, memory usage, and overall system performance.
Add Prometheus and Grafana Helm repositories#
helm repo add prometheus-community https://prometheus-community.github.io/helm-charts
helm repo add grafana https://grafana.github.io/helm-charts
helm repo update
Note
Since we already configured MetalLB in Part 2, we can leverage it to expose both Prometheus and Grafana services externally via LoadBalancer type services.
Install Prometheus#
helm install prometheus prometheus-community/prometheus \
  --namespace monitoring \
  --create-namespace \
  --set server.service.type=LoadBalancer
Once installed, we need to edit the configmap of Prometheus to add the metrics from the gpu-operator-metrics-exporter as another scrape source.
First, let us get the CLUSTER-IP of the gpu-operator-metrics-exporter by running:
kubectl get svc -n kube-amd-gpu
We should see something similar to the following:
NAME                                              TYPE        CLUSTER-IP       EXTERNAL-IP   PORT(S)          AGE
amd-gpu-operator-kmm-controller-metrics-service   ClusterIP   10.152.183.145   <none>        8443/TCP         23h
amd-gpu-operator-kmm-webhook-service              ClusterIP   10.152.183.172   <none>        443/TCP          23h
gpu-operator-metrics-exporter                     NodePort    10.152.183.144   <none>        5000:32500/TCP
Note
Take note of the CLUSTER-IP for the gpu-operator-metrics-exporter service - you’ll need this for the next step.
Edit the Prometheus configuration to add the metrics source:
kubectl edit configmap prometheus-server -n monitoring
Navigate to the scrape_configs section of the configuration and add the following job_name entry
  - job_name: 'gpu-operator-metrics-exporter'
    static_configs:
      - targets:
        - '<METRICS-EXPORTER-CLUSTER-IP>:5000'  # Replace with your metrics exporter's CLUSTER-IP
    metrics_path: '/metrics'
To confirm that Prometheus is scraping the metrics, navigate to the Prometheus UI in your browser by getting the EXTERNAL IP of Prometheus via:
kubectl get svc -n monitoring
You should see an entry similar to the following Prometheus server:
NAME               TYPE           CLUSTER-IP       EXTERNAL-IP     PORT(S)        AGE
prometheus-server  LoadBalancer   10.152.183.143   10.216.71.231   80:32617/TCP   161m
Navigating to the EXTERNAL-IP in your browser and you should be greeted by the Prometheus UI:
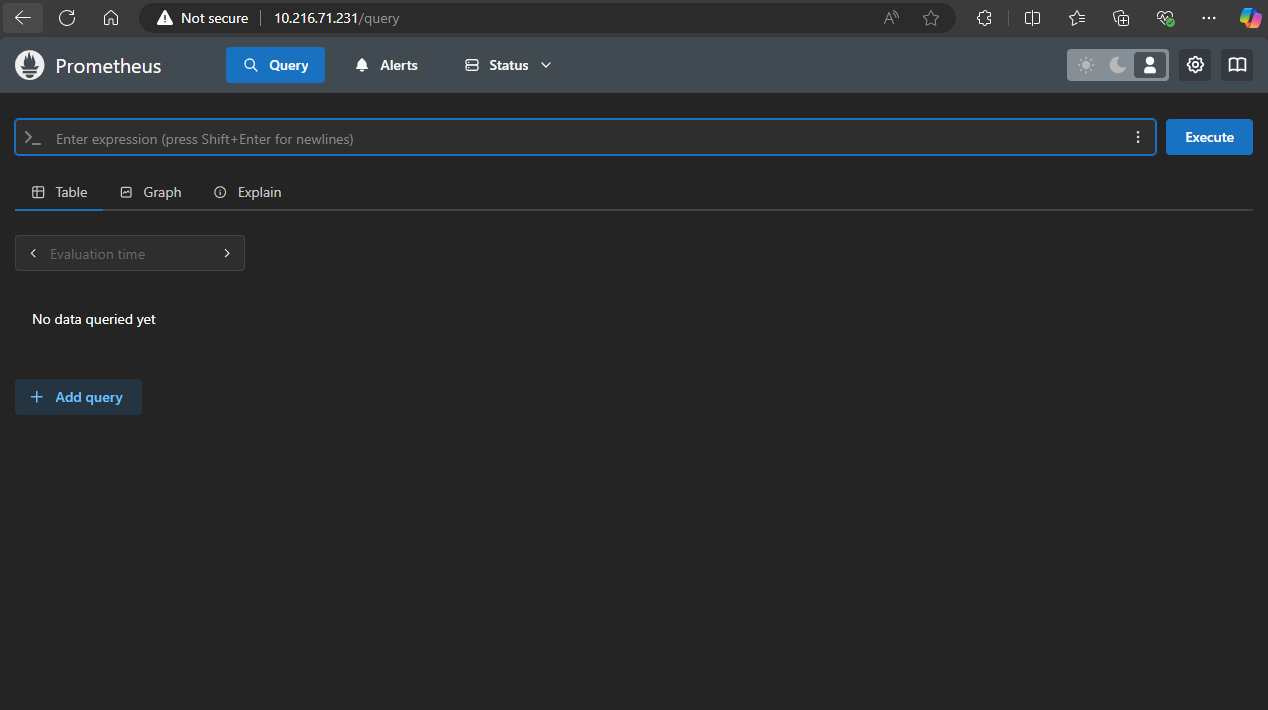 Confirm that Prometheus is scraping metrics correctly from the
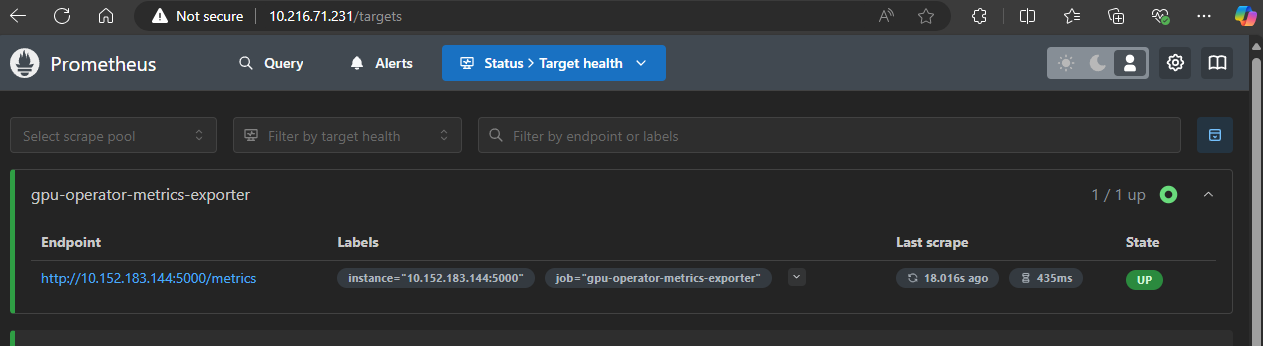
 gpu-operator-metrics-exporter by going to
Status > Target Health
There you should see the gpu-operator-metrics-exporter with State in the Up mode. If you are still unable to see the metrics, confirm the scrape_configs section of the configmap we edited is formatted correctly and try again (this is usually the main source of issues).
Install and configure Grafana#
To install Grafana we will run:
helm install grafana grafana/grafana \
  --namespace monitoring \
  --set server.service.type=LoadBalancer
To confirm that our load balancer has assigned external addresses to Grafana we can run:
kubectl get services -n monitoring
Among other services, we should also see something similar to:
NAME          TYPE           CLUSTER-IP       EXTERNAL-IP     PORT(S)        AGE
grafana       LoadBalancer   10.152.183.126   10.216.71.232   80:32658/TCP   100m
Note the EXTERNAL-IP of Grafana, it’s what we will be using to navigate to its UI in our web browser. In our example above we would navigate to http://10.216.71.232/login.
You should be greeted with the Grafana login screen below.
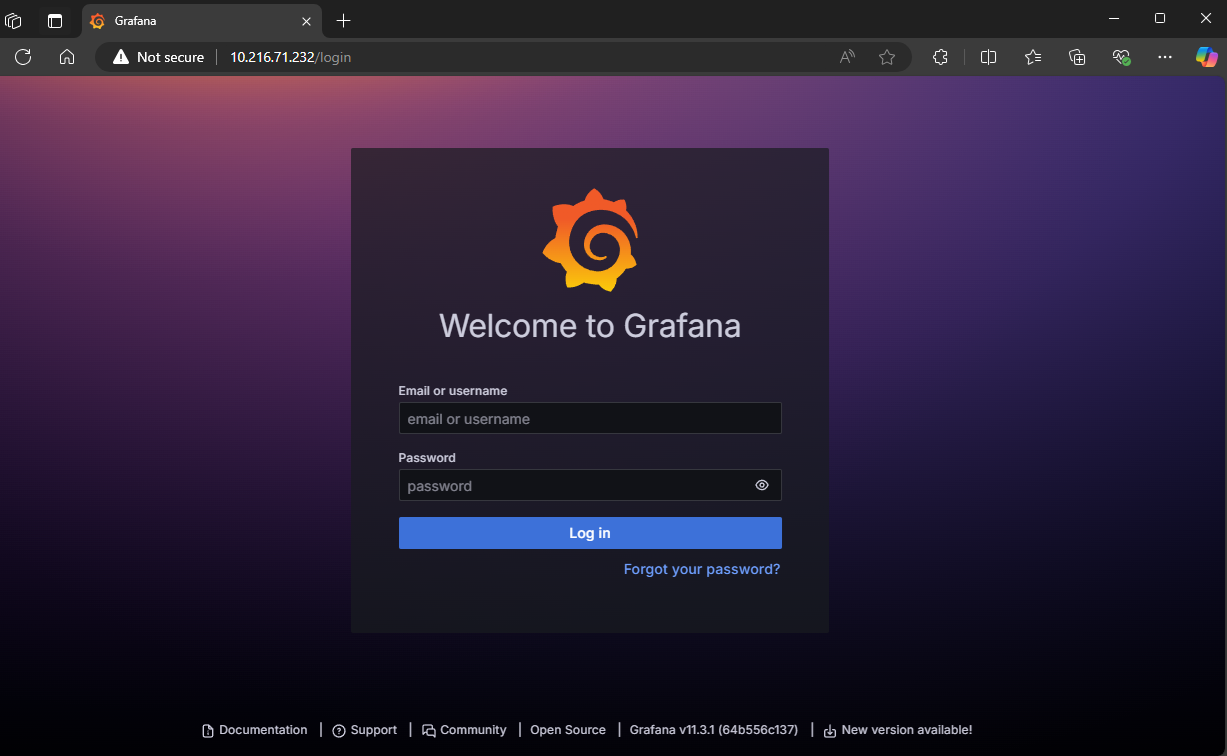
The default admin username is admin but you will need to get the admin password by running the following in your terminal:
kubectl get secret --namespace monitoring grafana -o jsonpath="{.data.admin-password}" | base64 --decode ; echo
Configure Grafana data source#
Grafana needs to be initialized with a Prometheus data source for metric scraping. To do this, we utilize the Grafana UI.
Access the Grafana UI using the external IP (retrieve using
kubectl get svc -n monitoring)Navigate to Connections > Data Sources
Click “Add data source” and select Prometheus
Enter the Prometheus server URL (http://
) Click “Save & Test” to verify the connection
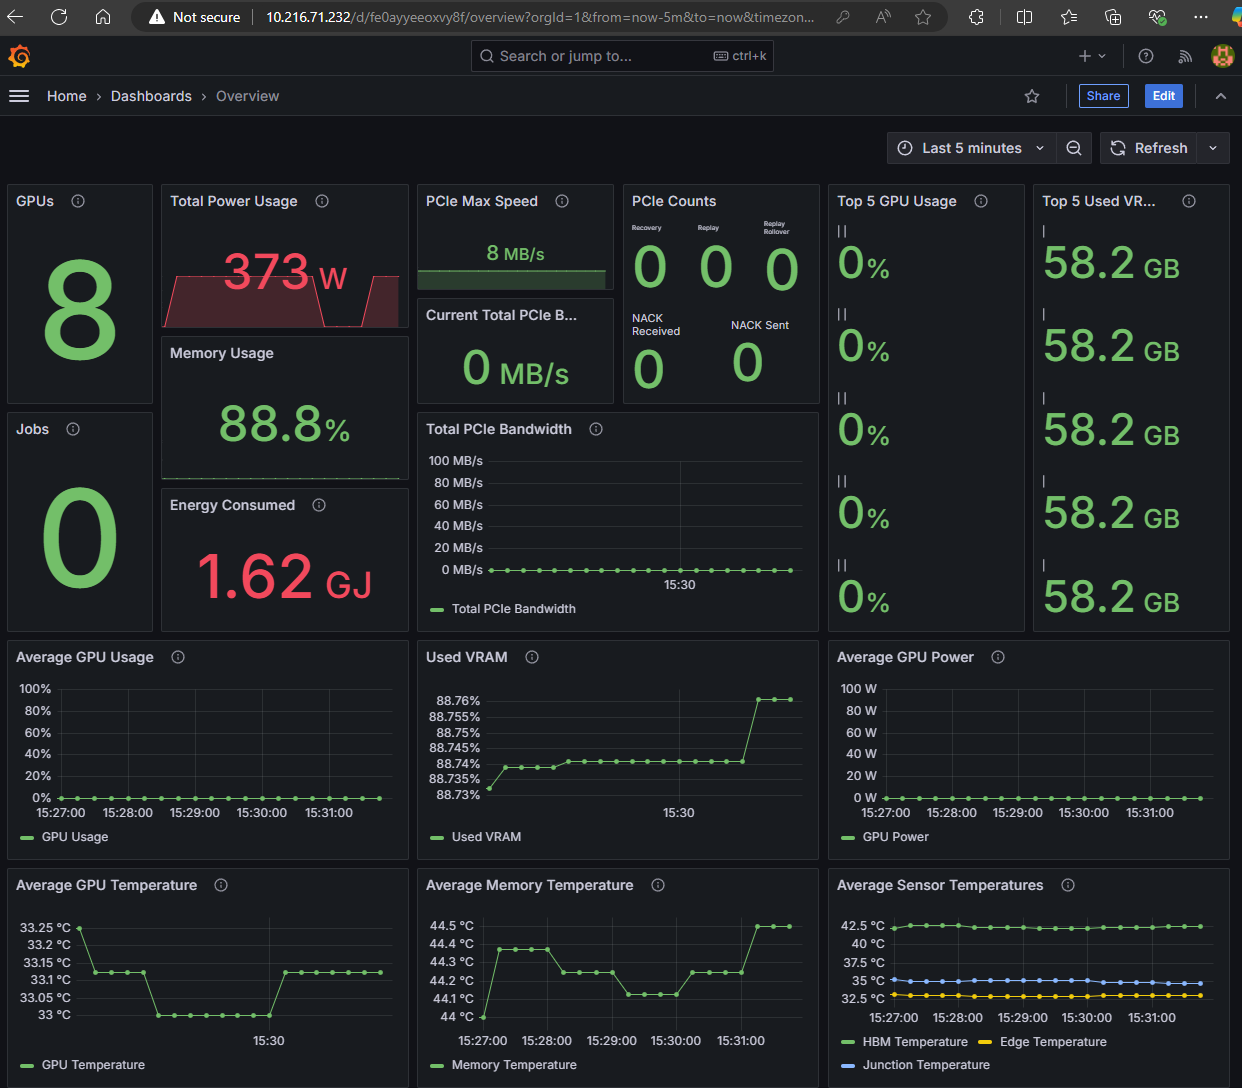
Import GPU Dashboards#
The ROCm GPU Operator provides pre-configured Grafana dashboards for monitoring Instinct GPUs. These can be found in the ROCm GPU Operator GitHub repository.
To import a dashboard:
Navigate to Dashboards > Import in the Grafana UI
Copy the contents of any dashboard JSON file from the repository
Paste into the import wizard
Select your Prometheus data source
Click “Import”
Implementing Open WebUI#
Now that we have our vLLM inference engine deployed (and scaling) we could provide an out-of-the-box intuitive web UI for end users to interact with LLMs on AMD hardware. For that we will utilize Open WebUI.
Open WebUI is an extensible, feature-rich, and user-friendly self-hosted WebUI designed to operate entirely offline. It supports various LLM runners, including Ollama and OpenAI-compatible APIs.
Since vLLM utilizes an OpenAI-compatible API for hosting LLMs, Open WebUI will be able to use it as our backend LLM service.
We will utilize similar deployment manifests as our vLLM deployment in Part 2 to deploy Open WebUI. These are:
Deploy Open WebUI#
We’ll create three Kubernetes manifests to deploy Open WebUI:
open-webui-pvc.yaml- persistent storage for Open WebUI’s user management and chat histories#open-webui-pvc.yaml apiVersion: v1 kind: PersistentVolumeClaim metadata: name: open-webui-pvc namespace: default spec: accessModes: - ReadWriteOnce resources: requests: storage: 10Gi # Adjust storage size as needed
open-webui-deployment.yaml- an instance of Open WebUI configured to connect to our vLLM engineapiVersion: apps/v1 kind: Deployment metadata: name: open-webui namespace: default spec: replicas: 1 selector: matchLabels: app: open-webui template: metadata: labels: app: open-webui spec: containers: - name: open-webui image: ghcr.io/open-webui/open-webui:0.5.18 ports: - containerPort: 8080 # Container exposes port 8080 env: - name: OPENAI_API_BASE_URL value: "http://10.228.20.200/v1" # Use your vLLM service's external IP - name: OPENAI_API_KEY value: "test1234" # Necessary for Open WebUI to function, can be anything - name: ENABLE_OLLAMA_API value: "false" - name: ENABLE_RAG_WEB_SEARCH value: "false" - name: RAG_WEB_SEARCH_ENGINE value: "duckduckgo" volumeMounts: - mountPath: /app/backend/data # Mount path inside the container name: open-webui-data volumes: - name: open-webui-data persistentVolumeClaim: claimName: open-webui-pvc
open-webui-service.yaml- a service manifest for exposing the WebUI outside our cluster#open-webui-service.yaml apiVersion: v1 kind: Service metadata: name: open-webui # Indentation fixed here namespace: default spec: type: LoadBalancer # Exposes the service externally ports: - port: 80 # External port to expose targetPort: 8080 # Port the container is listening on protocol: TCP selector: app: open-webui
Note
Make sure to update the OPENAI_API_BASE_URL in the deployment manifest to match your vLLM service’s external IP address.
We apply the manifests with
kubectl apply -f open-webui-pvc.yaml
kubectl apply -f open-webui-deployment.yaml
kubectl apply -f open-webui-service.yaml
Verify the Deployment#
After a few moments of the container being pulled and pods spinning up, running kubectl get deployments should show output similar to this:
NAME           READY   UP-TO-DATE   AVAILABLE   AGE
llama-3-2-1b   1/1     1            1           4h9m
open-webui     1/1     1            1           2s
Running kubectl get pods should show:
NAME                            READY   STATUS    RESTARTS   AGE
llama-3-2-1b-55d7d48f67-crdkj   1/1     Running   0          97m
open-webui-54df7bb5c-457bt      1/1     Running   0          47s
Finally, running kubectl get svc will give us the EXTERNAL-IP of our Open WebUI service
NAME           TYPE           CLUSTER-IP       EXTERNAL-IP     PORT(S)          AGE
kubernetes     ClusterIP      10.152.183.1     <none>          443/TCP          2d1h
llama-3-2-1b   LoadBalancer   10.152.183.202   10.216.71.230   8000:32703/TCP   4h3m
open-webui     LoadBalancer   10.152.183.111   10.216.71.233   80:31240/TCP     4h3m
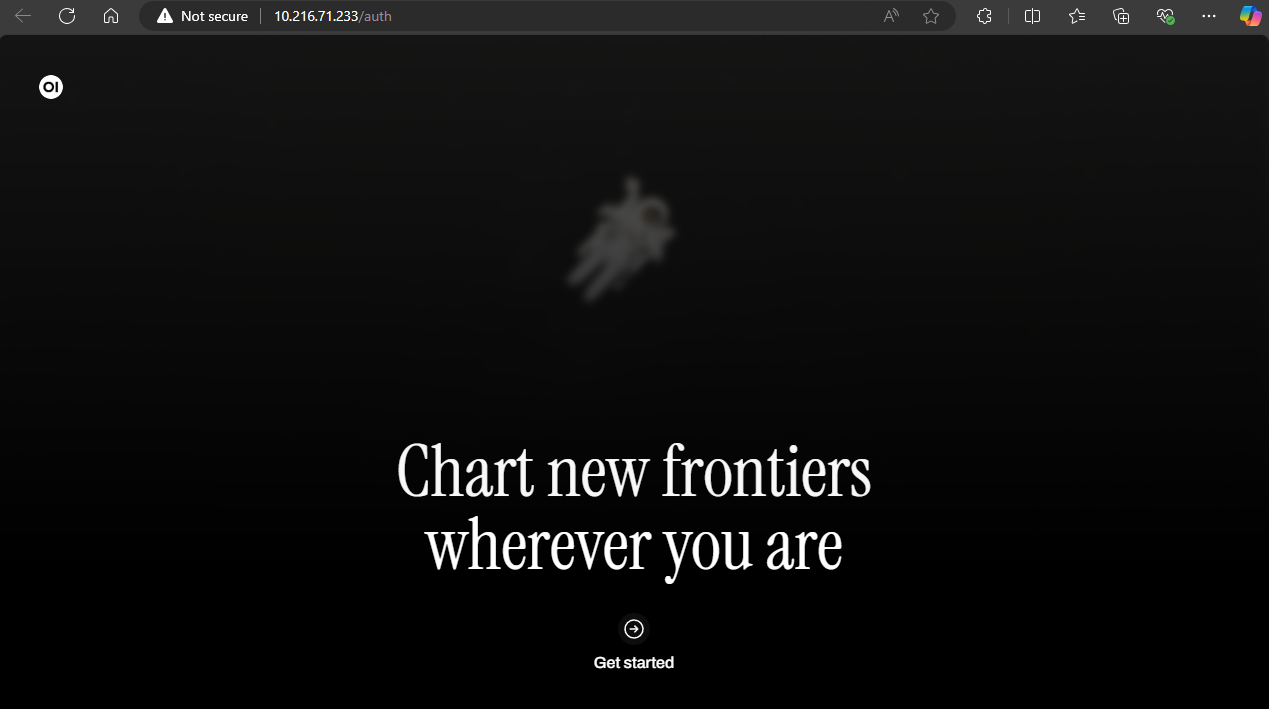
Access the WebUI by navigating to http://<OPEN-WEBUI-EXTERNAL-IP> in your browser.
Note
The first user to register on Open WebUI automatically becomes an administrator. Secure these credentials appropriately for production deployments.
In our example we will open up our browser to http://10.216.71.233. If you are the first user of this instance of the app, you will be greeted by the Get Started webpage and asked to provide a name, email and password once you click. By default, this first account becomes an admin account.
After logging in you should see the following.
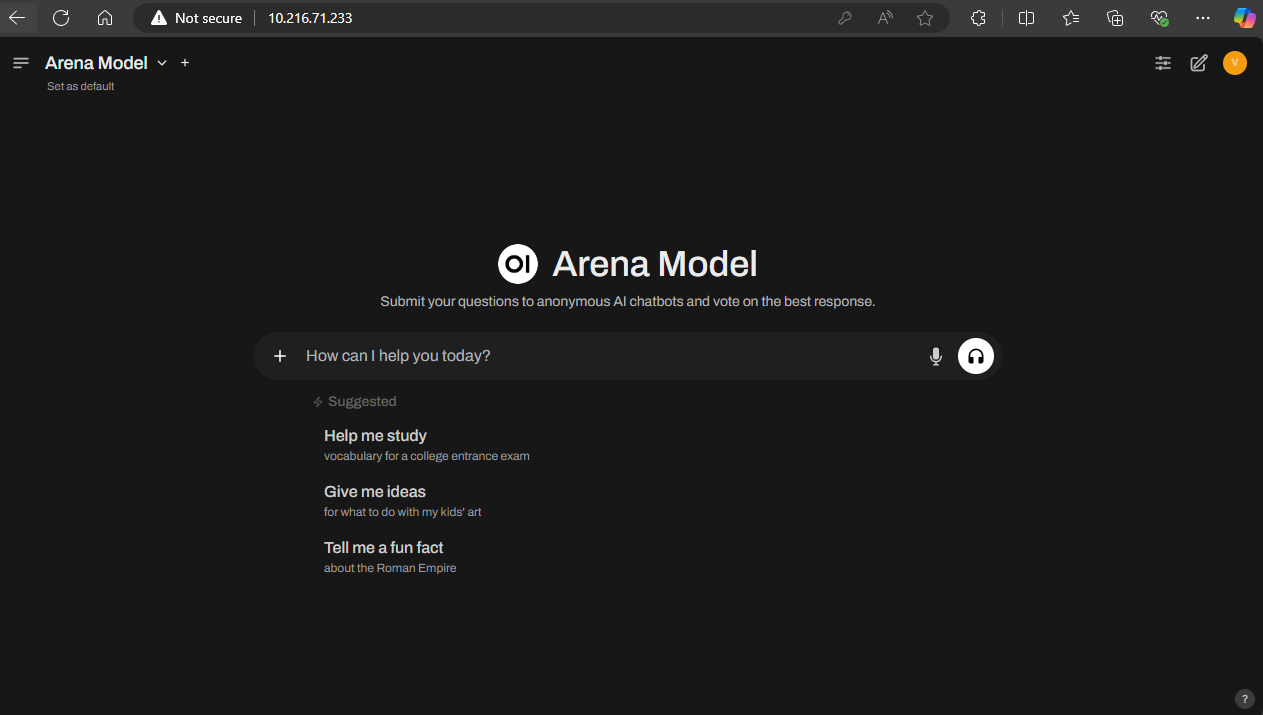
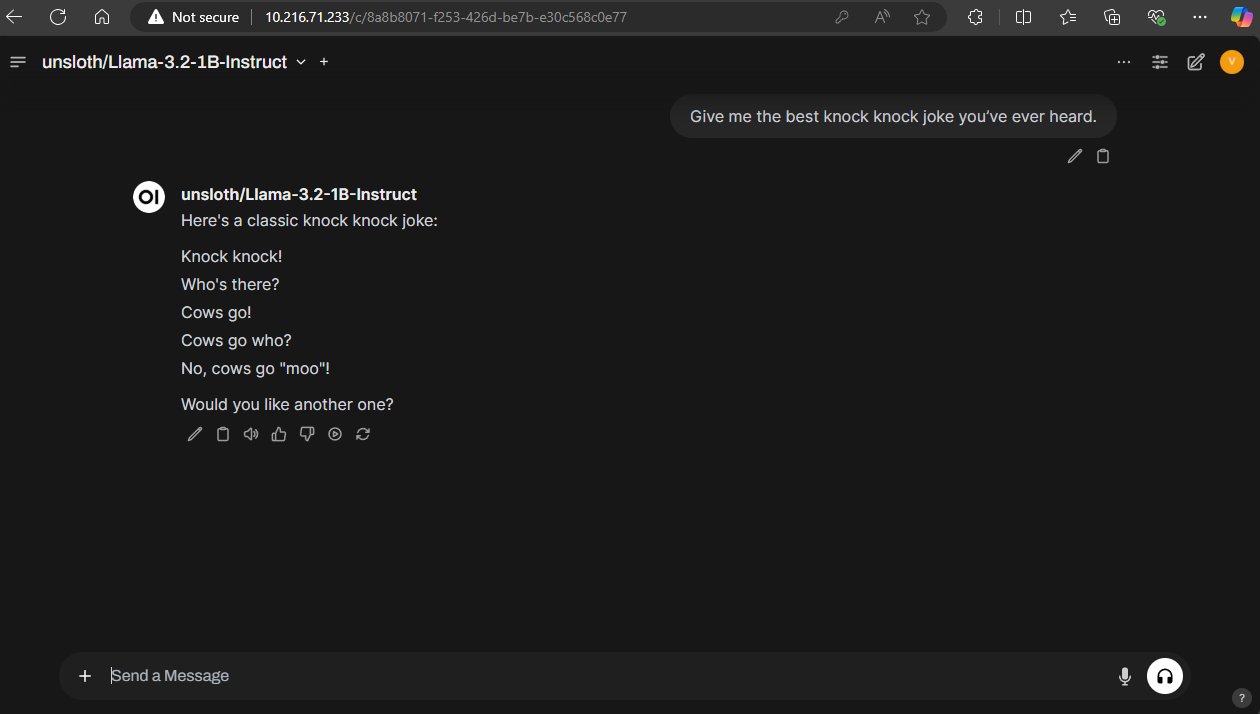
If the deployment was successful in reaching the vLLM API, you should now see an option to choose the model hosted by vLLM for use in Open WebUI. In our instance, that is unsloth/Llama-3.2-1B-Instruct
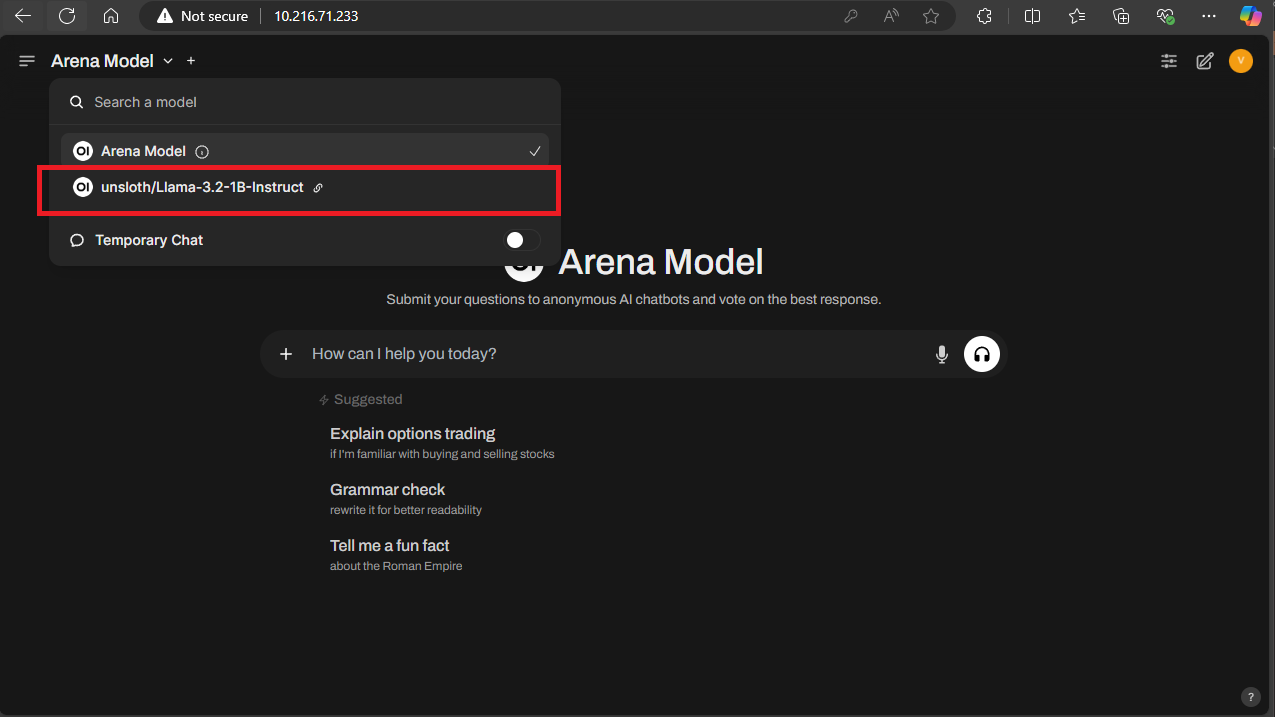
Now you can talk to your model however you see fit!
Summary#
This concludes our series on AI inference orchestration with Kubernetes on AMD Instinct MI300X. With this setup, you are now equipped to handle large-scale AI inference workloads efficiently. By following this 3-part guide, you have successfully set up a robust and scalable infrastructure, covering:
Kubernetes and Helm installation
Persistent storage setup for caching LLMs
AMD GPU Operator integration
vLLM engine deployment
Load Balancing via MetalLB, and
Monitoring with Prometheus and Grafana,
Open WebUI for an intuitive user interface.
As you move forward, consider the following next steps to optimize and expand your deployment:
Monitor: Continuously track performance metrics and ensure system reliability using tools like Grafana and Prometheus.
Optimize: Experiment with GPU and fine-tuning frameworks to fine-tune your models.
Enhance: Leverage additional Kubernetes resources such as external data stores to strengthen your infrastructure.
Learn: Stay updated with the latest developments by exploring vLLM documentation and community forums.
Upgrade: Take advantage of our recently released AMD GPU Operator v1.2.0, which introduces new capabilities including automated GPU health monitoring with customizable thresholds, intelligent removal of unhealthy GPUs from the scheduling pool, seamless driver upgrades with node drain/cordon management, and a test runner for diagnosing GPU issues. For complete details, check the GitHub release or the full release notes.
With this guide as a foundation, you are now prepared to handle large-scale AI inference workloads efficiently. Best of luck as you continue to build and innovate with Instinct on Kubernetes!
Disclaimers
Third-party content is licensed to you directly by the third party that owns the content and is not licensed to you by AMD. ALL LINKED THIRD-PARTY CONTENT IS PROVIDED “AS IS” WITHOUT A WARRANTY OF ANY KIND. USE OF SUCH THIRD-PARTY CONTENT IS DONE AT YOUR SOLE DISCRETION AND UNDER NO CIRCUMSTANCES WILL AMD BE LIABLE TO YOU FOR ANY THIRD-PARTY CONTENT. YOU ASSUME ALL RISK AND ARE SOLELY RESPONSIBLE FOR ANY DAMAGES THAT MAY ARISE FROM YOUR USE OF THIRD-PARTY CONTENT.