Debugging NaN Results in CK Tile GEMM: A rocgdb Detective Story#

When developing high-performance GPU kernels, subtle bugs can lead to catastrophic failures like NaN (Not-a-Number) outputs. This post chronicles our journey of debugging a tricky NaN issue in AMD’s Composable Kernel (CK) Tile GEMM implementation using rocgdb. What started as mysterious NaN outputs ended with discovering a single-character typo that corrupted the data distribution.
In this blog, you will learn how to:
Simplify complex GPU bugs by reducing problem size and using predictable inputs to make issues deterministic and traceable
Use rocgdb effectively for GPU kernel debugging, including thread inspection, variable printing, and stepping through device code
Trace data flow systematically by working backwards from incorrect outputs to pinpoint where corruption occurs
Recognize tensor distribution bugs—a subtle class of issues where data loads correctly but is interpreted using the wrong memory layout
Source Code: The example code discussed in this blog is available at: https://github.com/ROCm/composable_kernel/tree/toy_example/example/ck_tile/99_toy_example/02_gemm
TL;DR: A typo in a type declaration (ALdsTile instead of BLdsTile) caused the B-matrix data to use the wrong tensor distribution, leading to data corruption and NaN results when instruction scheduling was enabled.
The Problem#
Initial Symptoms#
We were testing a CK Tile GEMM kernel with the following configuration:
*** Kernel G test ***
--> Using mfma_16x16x(16x2)
--> XOR-based bank-conflict-free
--> Adjust block tile shape
--> Enable prefetch
--> Enable instruction schedule
Test Case: Matrix multiplication with M=3328, N=4096, K=4096
Results:
grid size 832
Error: Incorrect results!    out[32] != ref[32]: -nan != 313
Error: Incorrect results!    out[33] != ref[33]: -nan != -59
Error: Incorrect results!    out[34] != ref[34]: -nan != -772
Error: Incorrect results!    out[35] != ref[35]: -nan != -434
max err: inf, number of errors: 10221412, 74.98383% wrong values
valid:n
Perf: 0.727292 ms, 153.541 TFlops, 121.107 GB/s
Key Observations:
The kernel produced
-nanvalues74.98% of the outputs were incorrect
The issue only occurred when both prefetch AND instruction scheduling were enabled
Disabling either feature made the kernel work correctly
This suggested a race condition or a data corruption issue in the prefetch path.
Environment Setup#
GPU: AMD MI300X
ROCm Version: 6.4
Architecture: gfx942
Build Configuration:
cmake -D CMAKE_PREFIX_PATH=/opt/rocm \
      -D CMAKE_CXX_COMPILER=/opt/rocm/bin/hipcc \
      -D CMAKE_BUILD_TYPE=Debug \
      -D GPU_TARGETS="gfx942" \
      -D CMAKE_CXX_FLAGS="-O0 -g" \
      -Dkernel=G ..
Note the -O0 -g flags for debuggable code with symbols.
Data Flow Overview#
Before diving into debugging, let’s understand the data flow in a CK Tile GEMM kernel. As shown in Figure 1 below, the data passes through five key stages:
Global Memory: Input matrices A and B are stored in global (device) memory
Shared Memory (LDS): Data is loaded into Local Data Share for faster access within a workgroup
Tile Registers: Data is prefetched from LDS into distributed tile registers with specific tensor distributions
Warp Registers: Data is sliced into warp-level vectors for MFMA instructions
Execution: MFMA (Matrix Fused Multiply-Add) computes the result
Our debugging strategy involves two key approaches:
Simplify the problem - Reduce the problem size and use simple inputs to make the bug deterministic and easier to trace
Work backwards from the incorrect output - Check each stage systematically to identify where data corruption occurs
In the diagrams throughout this post, we use color coding to track our progress:
Gray: Not yet examined
Green: Verified correct
Yellow: Currently investigating
Red: Error found
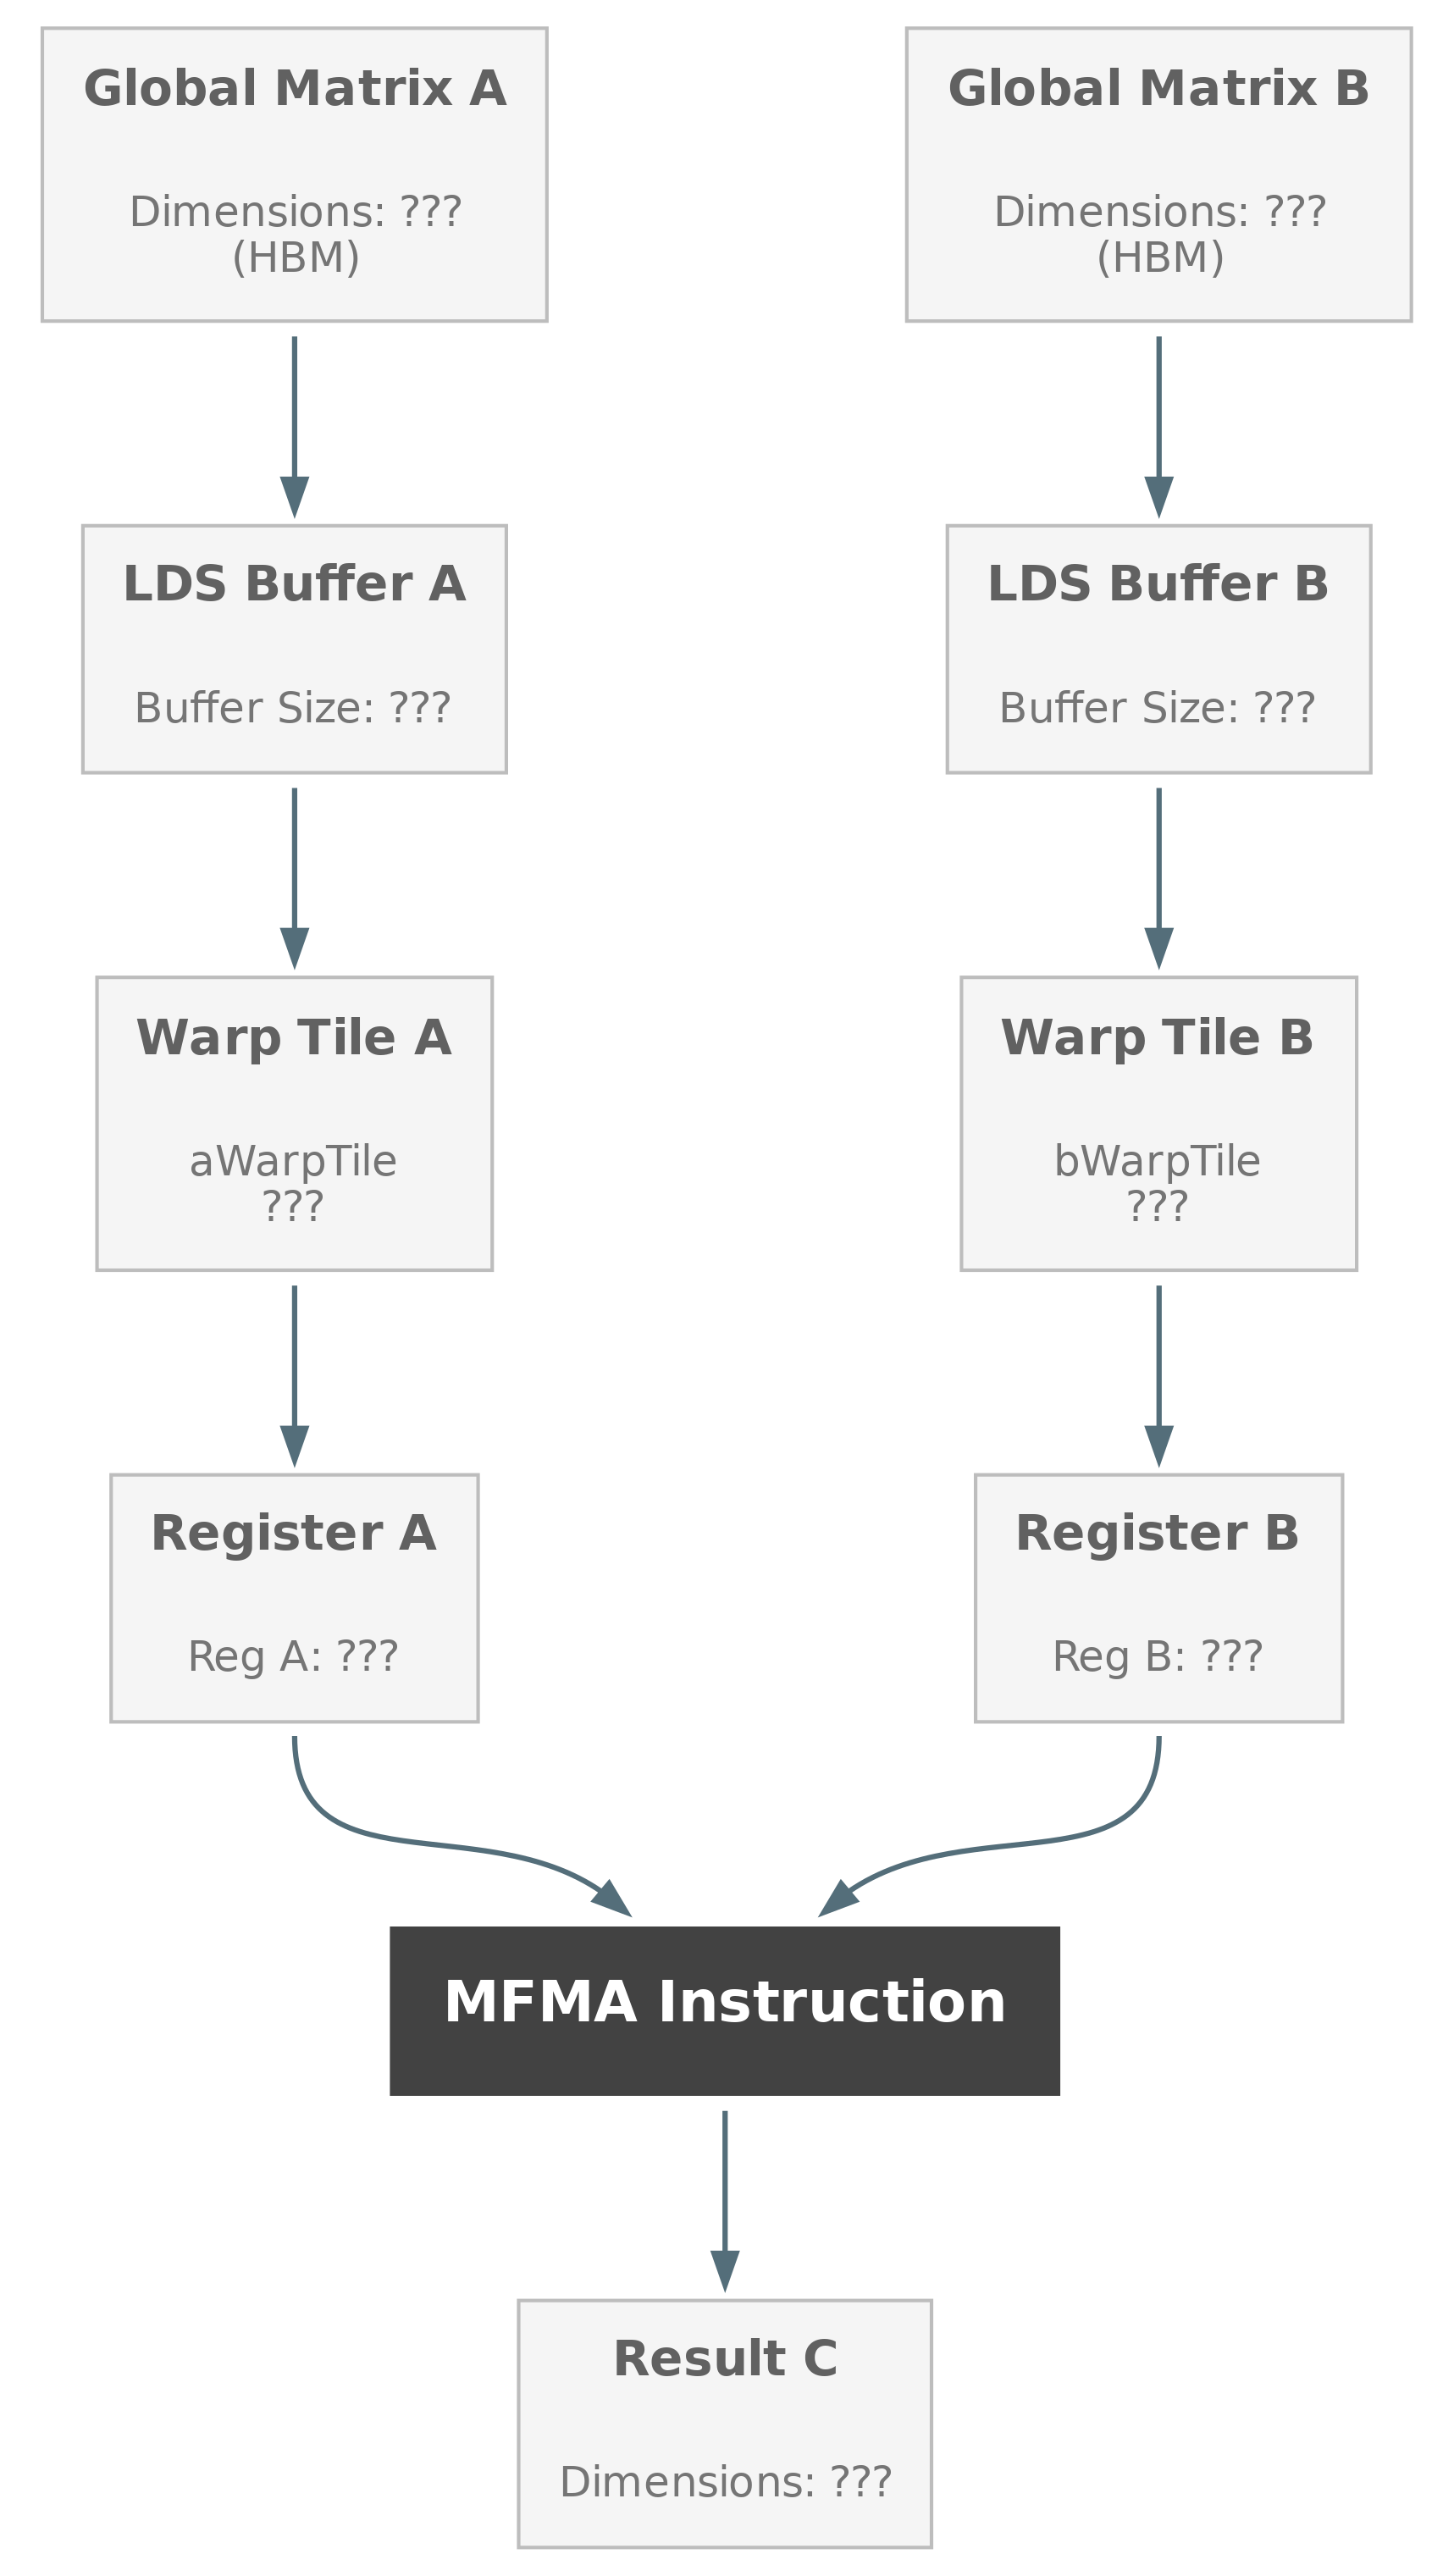
Figure 1: Data flow for GEMM#
Debugging Strategy: Simplify the Problem#
Before diving into rocgdb, we simplified the test case to make debugging tractable.
Step 1: Reduce Problem Size#
Original: M=3328, N=4096, K=4096 (832 blocks, multiple K-iterations)
Simplified: M=128, N=128, K=64 (1 block, single K-iteration)
This isolates a single block’s behavior and eliminates inter-block communication issues.
Result:
grid size 1
Error: Incorrect results!    out[0] != ref[0]: -32.0625 != 577
Error: Incorrect results!    out[1] != ref[1]: -2 != 56
Error: Incorrect results!    out[2] != ref[2]: -2 != -145
Error: Incorrect results!    out[3] != ref[3]: 513 != 50
max err: inf, number of errors: 16370, 99.91455% wrong values
valid:n
Good! The bug reproduces with a single block. No more NaN, but still 99.91% wrong.
Step 2: Simplify Input Data#
To verify memory access patterns, we set all inputs to 1:
ck_tile::FillUniformDistributionIntegerValue<ADataType>{1, 1}(a_host);
ck_tile::FillUniformDistributionIntegerValue<BDataType>{1, 1}(b_host);
Expected: Since A[i][k] = 1, B[k][j] = 1, and K=64, every output should be C[i][j] = 64
Result:
grid size 1
Error: Incorrect results!    out[0] != ref[0]: 0.00782759 != 64
Error: Incorrect results!    out[1] != ref[1]: 0.00782759 != 64
Error: Incorrect results!    out[2] != ref[2]: 0.00782759 != 64
Error: Incorrect results!    out[3] != ref[3]: 0.00782759 != 64
max err: 64, number of errors: 16384, 100% wrong values
valid:n
Perfect! Now we have a deterministic test case: all inputs are 1, expected output is 64, but we’re getting garbage values.
rocgdb Debugging Session#
Setting Up rocgdb#
Launch the debugger in non-stop mode for better thread control:
$ rocgdb ./bin/basic_gemm
(gdb) set non-stop on
Tip
For a quick reference of commonly used rocgdb commands, see the Appendix at the end of this blog.
Phase 1: Verify Global Memory Loading#
Hypothesis: Maybe data isn’t being loaded correctly from global memory?
Set a breakpoint after the first global memory load:
(gdb) b composable_kernel/99_toy_example/02_gemm/block_gemm_pipeline_agmem_bgmem_creg.hpp:335
(gdb) r
Code at breakpoint (Line 335):
325:    // Global read 0
326:    load_tile(a_block_tile, a_copy_dram_window);
327:    move_tile_window(a_copy_dram_window, a_dram_tile_window_step);
328:    load_tile(b_block_tile, b_copy_dram_window);
329:    move_tile_window(b_copy_dram_window, b_dram_tile_window_step);
330:
331:    // Initialize C
332:    tile_elementwise_inout([](auto& c) { c = 0; }, c_block_tile);
333:
334:    // LDS write 0
335:    store_tile(a_copy_lds_window, a_block_tile);
336:    store_tile(b_copy_lds_window, b_block_tile);
Inspect loaded tiles:
(gdb) thread 7
(gdb) p a_block_tile
$1 = {static PackedSize = 1, static kThreadElementSpaceSize = 32,
      thread_buf_ = {static N = 32, data = {1 <repeats 32 times>}}}
(gdb) p b_block_tile
$2 = {static PackedSize = 1, static kThreadElementSpaceSize = 32,
      thread_buf_ = {static N = 32, data = {1 <repeats 32 times>}}}
(gdb) p c_block_tile
$3 = {static PackedSize = 1, static kThreadElementSpaceSize = 64,
      thread_buf_ = {static N = 64, data = {0 <repeats 64 times>}}}
Conclusion: Global memory loading is correct! A and B tiles contain all 1s, C is initialized to 0. As you can see in Figure 2 below, we’ve verified the first stage of our data flow.
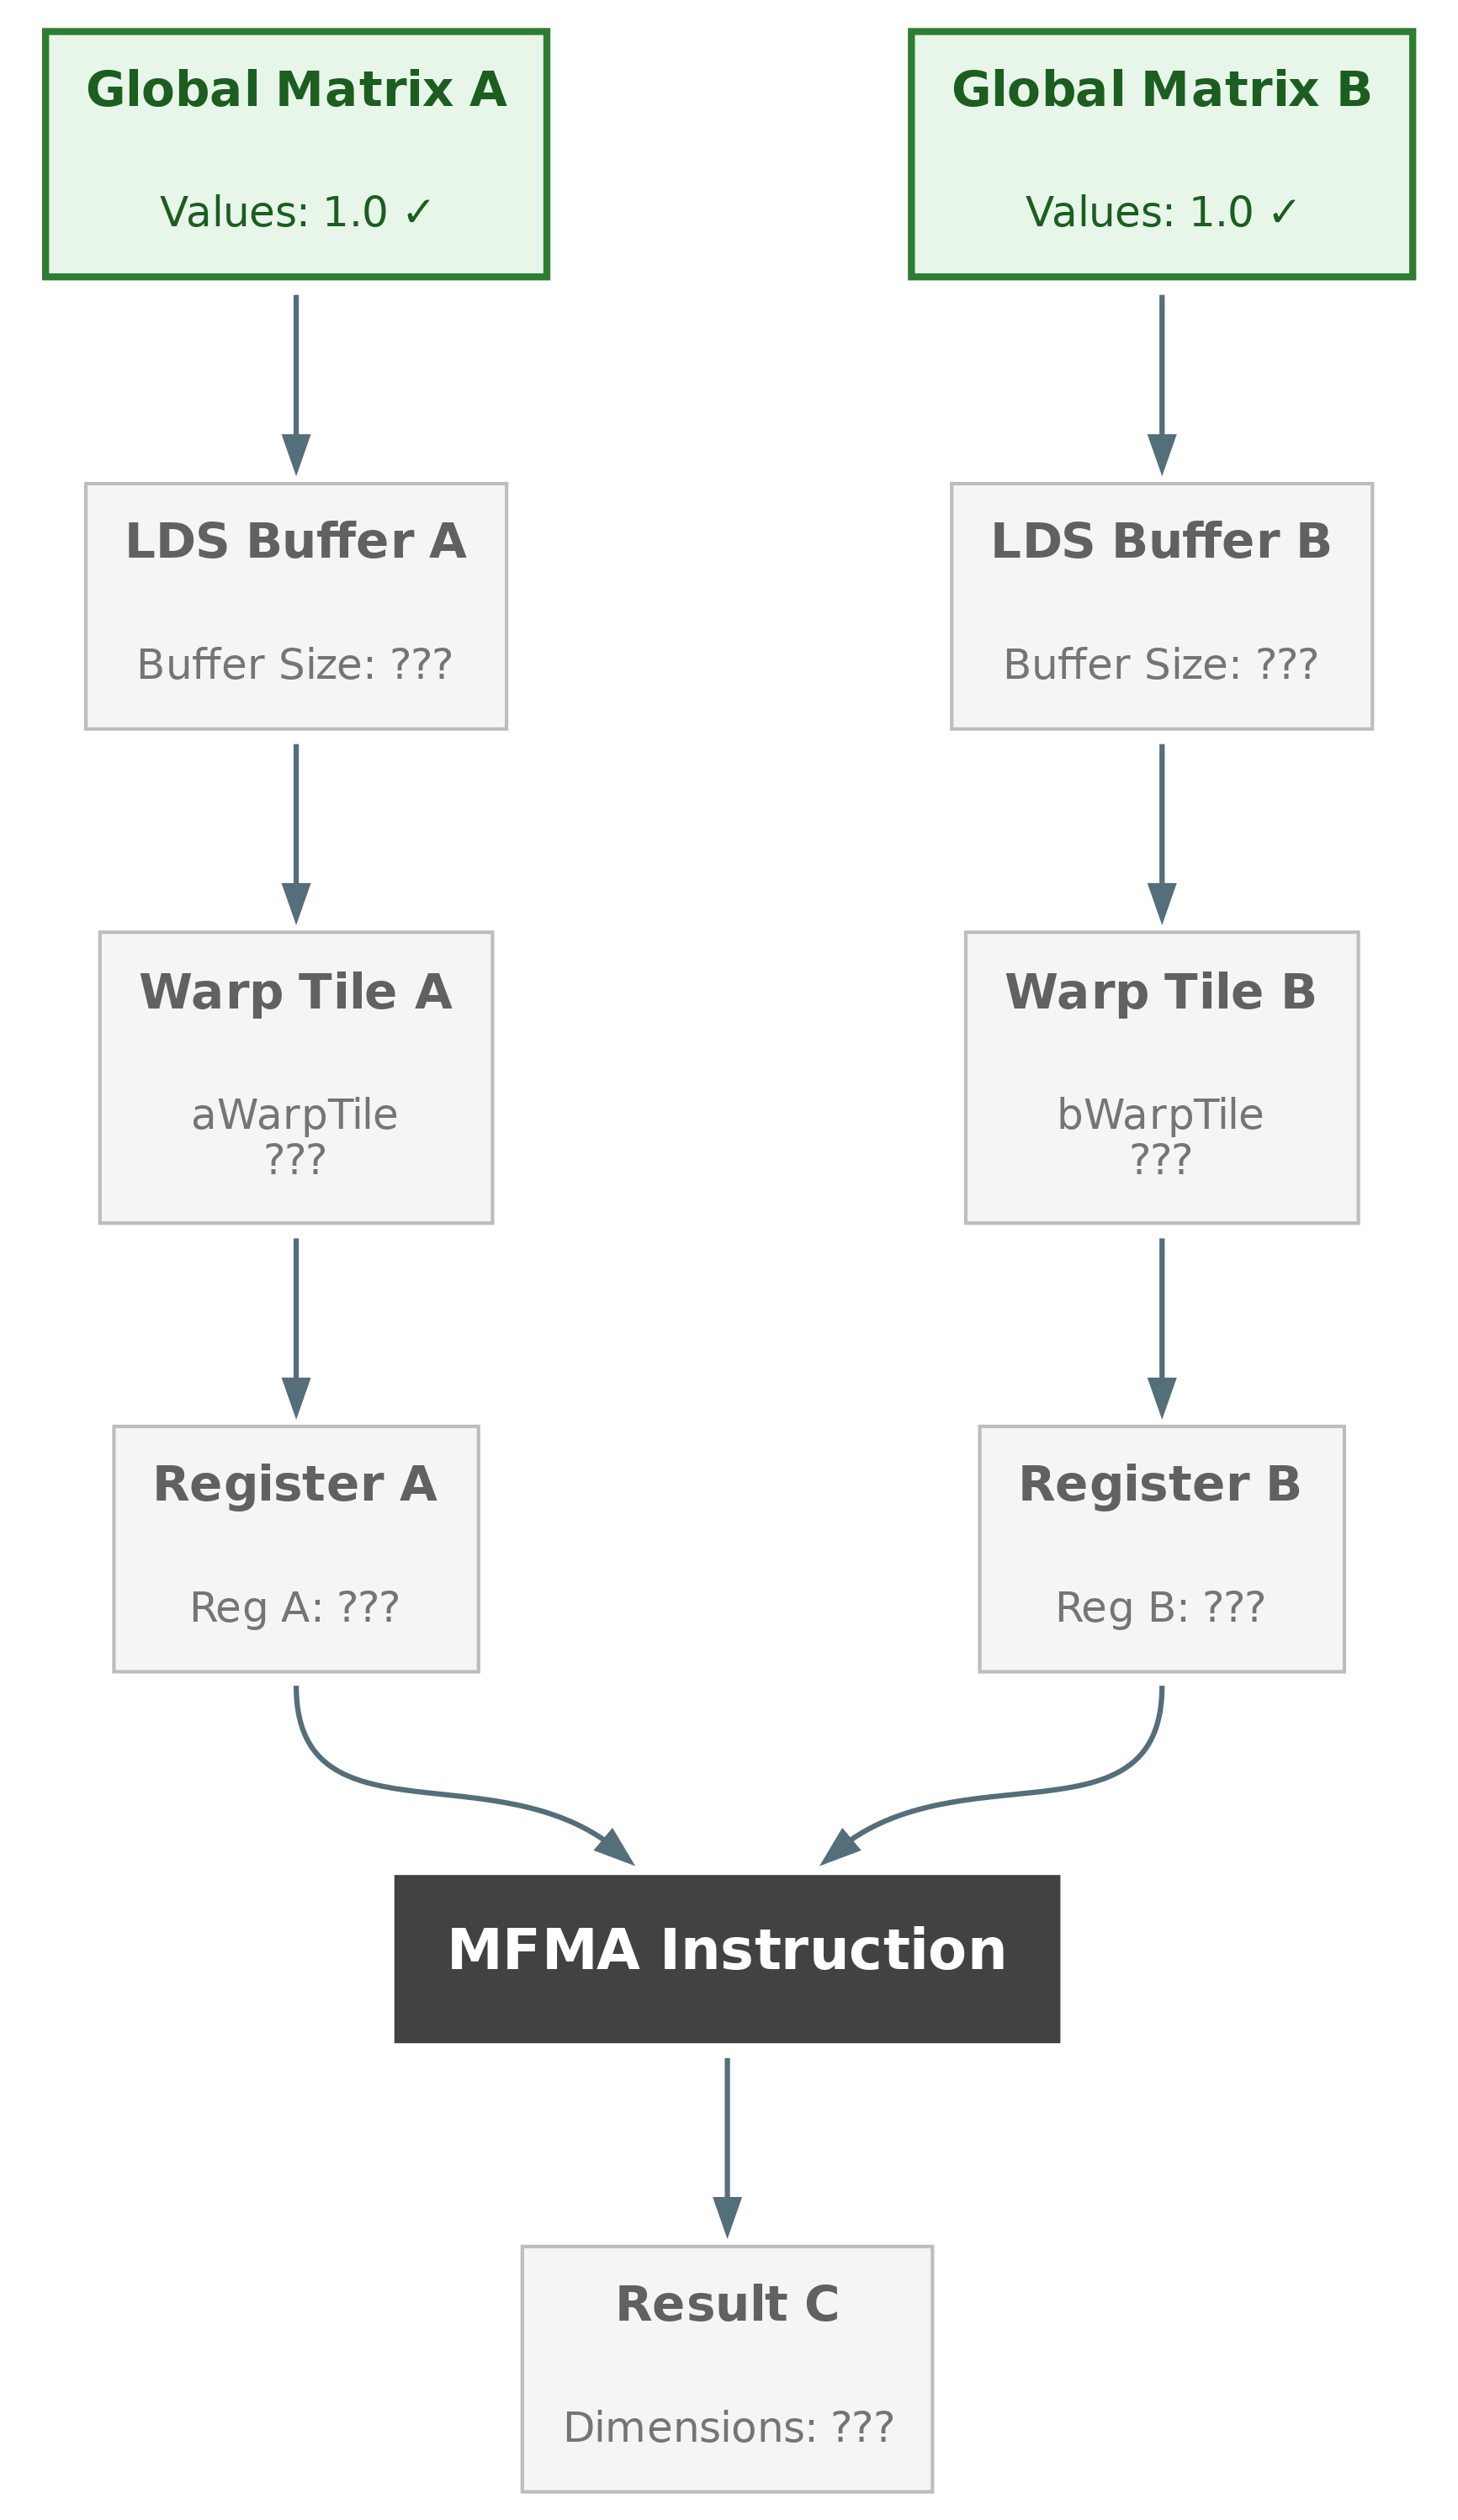
Figure 2: Data flow for GEMM after phase 1#
Phase 2: Verify GEMM Output#
Hypothesis: The bug must be in the GEMM computation.
Set a breakpoint after the block GEMM call:
(gdb) b composable_kernel/99_toy_example/02_gemm/block_gemm_pipeline_agmem_bgmem_creg.hpp:371
(gdb) c -a
Code at breakpoint (Line 371):
369:    block_gemm(c_block_tile, a_lds_gemm_window, b_lds_gemm_window);
370:
371:    block_sync_lds();
Inspect output:
(gdb) p c_block_tile
$22 = {static PackedSize = 1, static kThreadElementSpaceSize = 64,
       thread_buf_ = {static N = 64,
       data = {64.0078278, 64.0078278, 64.0078278, 64.0078278,
               64.0078278, 64.0078278, 64.0078278, 64.0078278,
               100.010765, 100.010765, 100.010765, 100.010765,
               100.264191, 100.264191, 100.264191, 100.264191,
               80.0697809 <repeats 12 times>,
               82.261234, 82.261234, 82.261234, 82.261234,
               64.0078278, 64.0078278, 100.010765, 100.010765,
               104.258995, 104.258995, 101.003181, 101.003181,
               101.125557, 101.125557, 100.002937, 100.002937,
               104.501816, 104.501816, 104.501816, 104.501816}}}
Analysis:
Expected: All values should be 64
Actual: Values range from ~64 to ~104
Pattern: Values repeat in groups of 4 (MFMA layout pattern)
Conclusion: The GEMM computation is producing wrong results! The data loaded from LDS was correct, but after computation we get corruption. Figure 3 below illustrates where the error is occurring in our data flow—the MFMA instruction is now under suspicion.
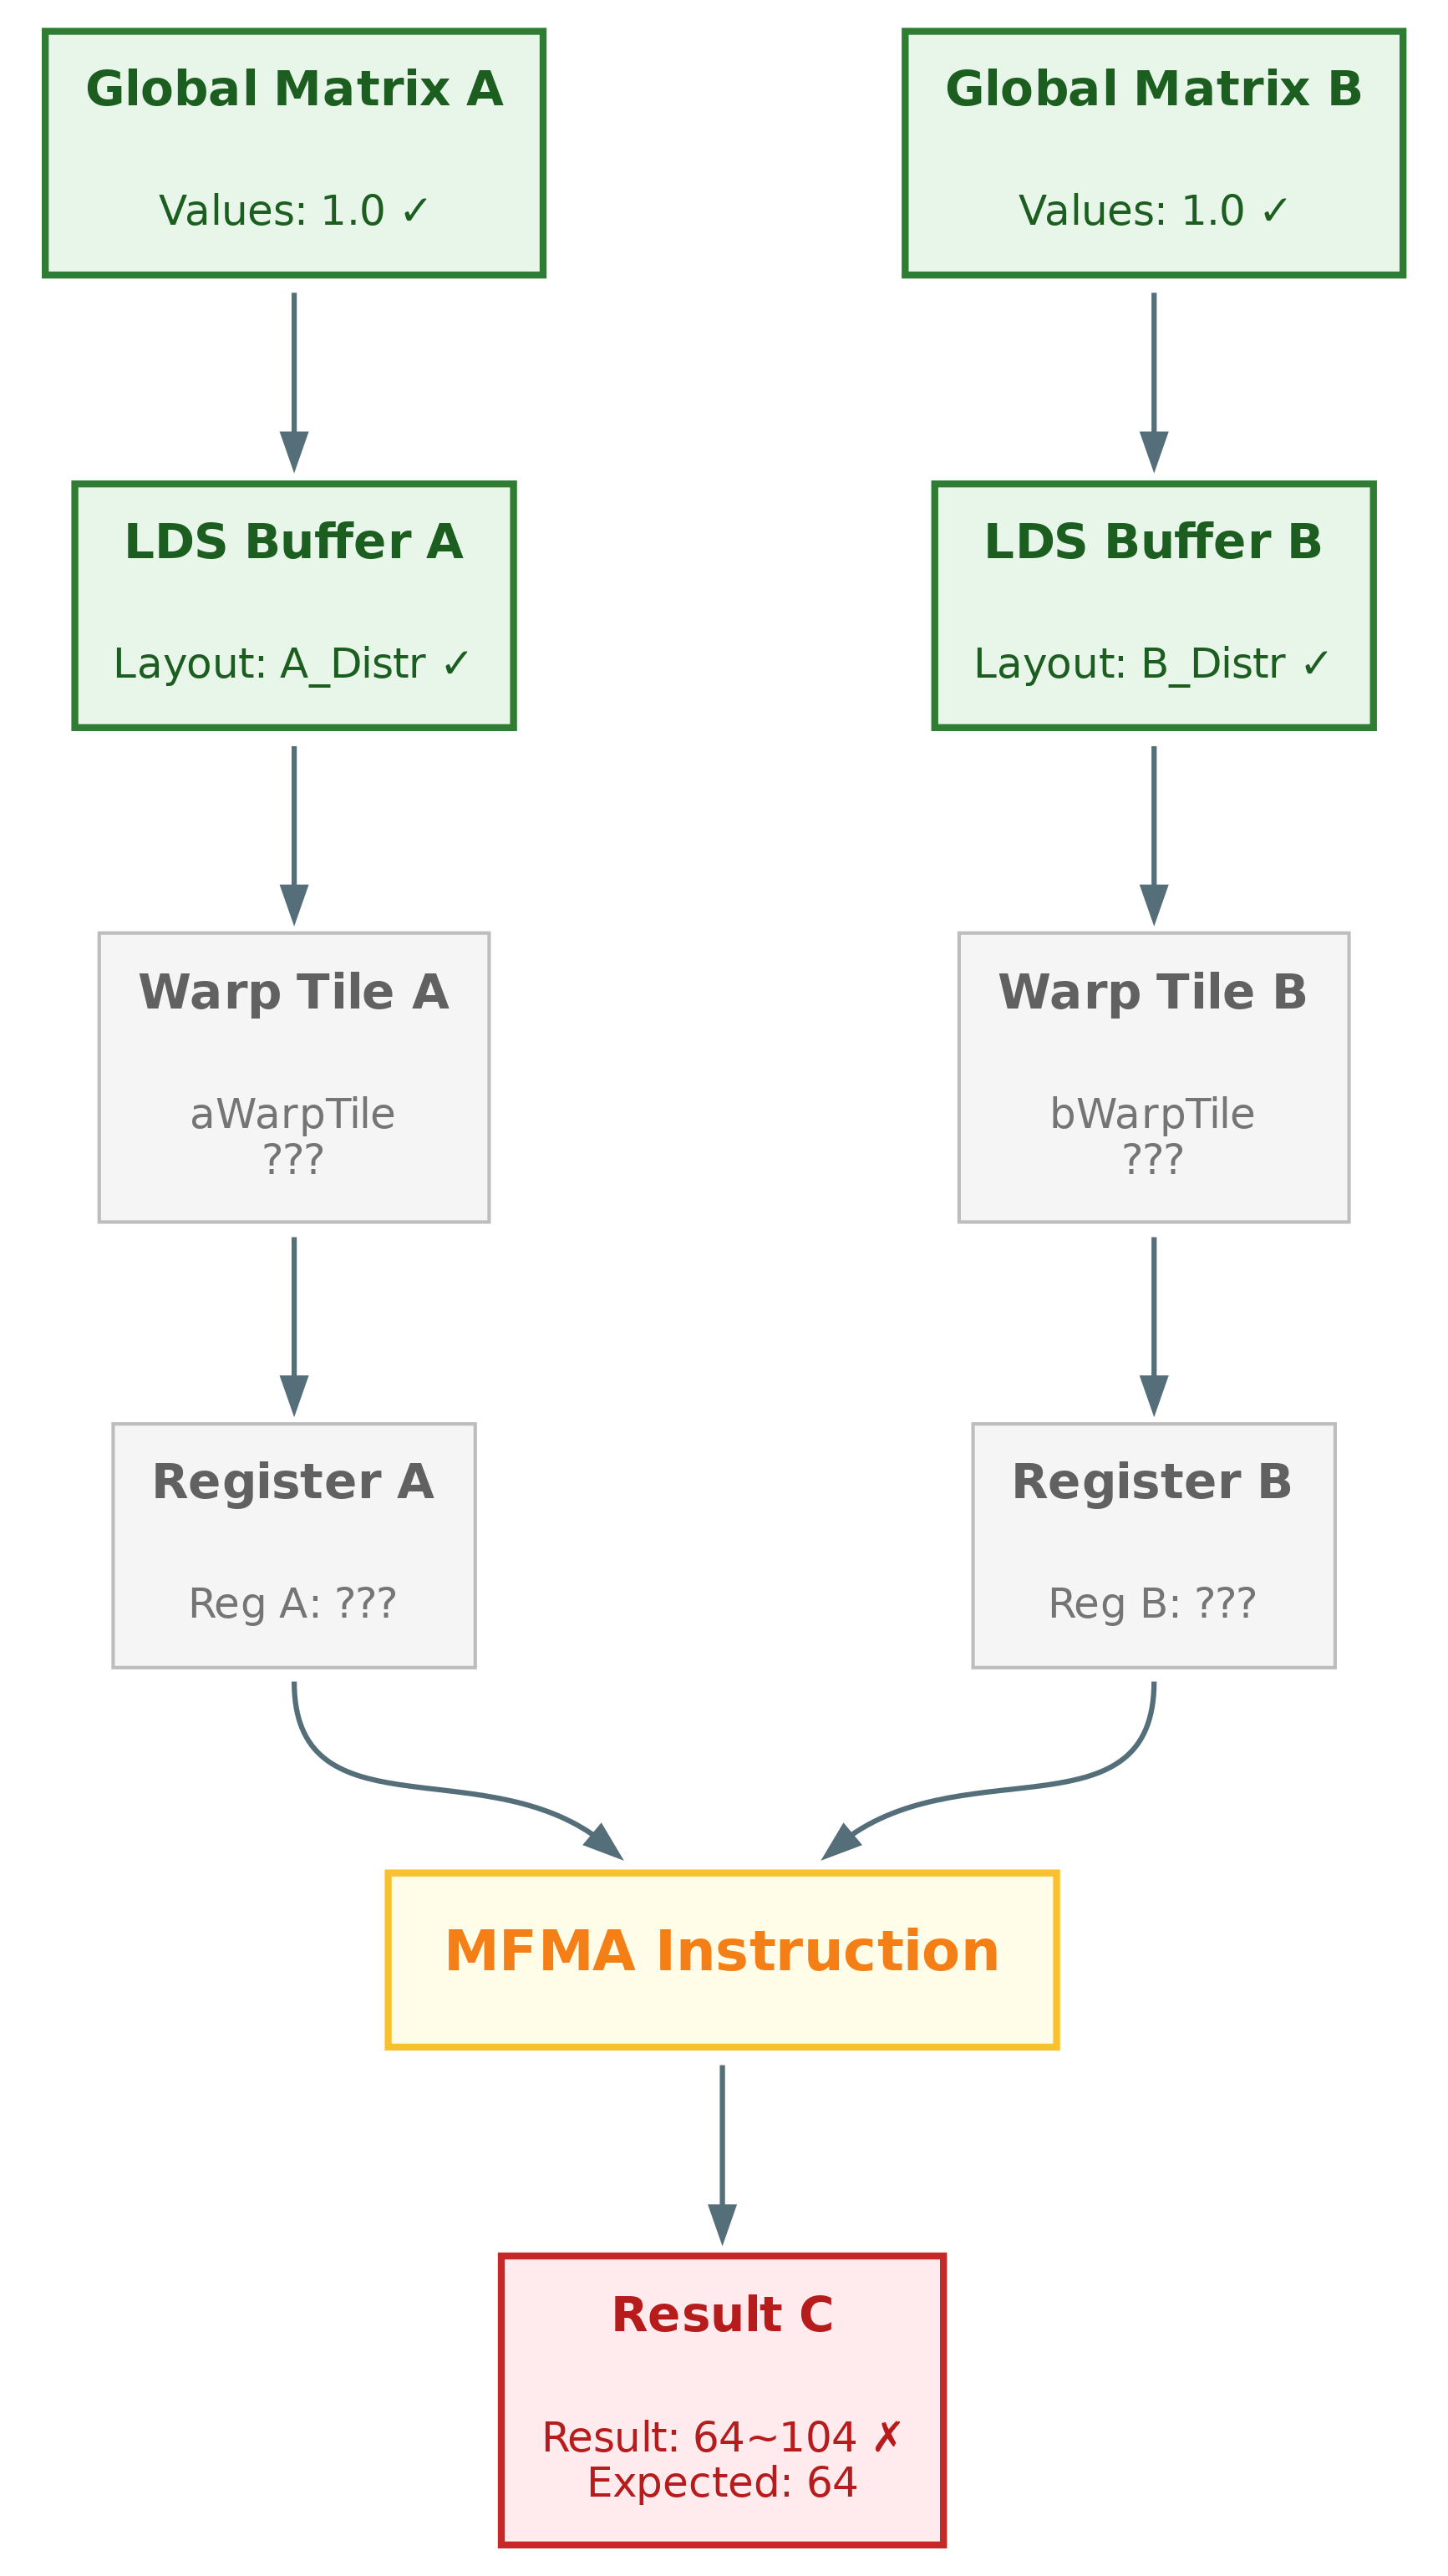
Figure 3: Data flow for GEMM after phase 2. MFMA instruction is suspicious#
Phase 3: Step Into Block GEMM#
Time to dig deeper. Set breakpoints inside the GEMM kernel:
(gdb) b composable_kernel/99_toy_example/02_gemm/block_gemm_asmem_bsmem_creg.hpp:218
(gdb) b composable_kernel/include/ck_tile/ops/gemm/warp/warp_gemm_impl.hpp:64
(gdb) r
Breakpoint 1 - Block GEMM hot loop (Line 218):
210:    // read C warp tensor from C block tensor
211:    CWarpTensor c_warp_tensor;
212:
213:    c_warp_tensor.get_thread_buffer() = c_block_tensor.get_y_sliced_thread_data(
214:        merge_sequences(sequence<mIter, nIter>{}, c_warp_y_index_zeros),
215:        merge_sequences(sequence<1, 1>{}, c_warp_y_lengths));
216:
217:    // warp GEMM
218:    WG{}(c_warp_tensor, a_warp_tensor, b_warp_tensor);
Breakpoint 2 - Inside Warp GEMM (Line 64):
57:    const auto a_vec = a.get_thread_buffer().template get_as<AVec>()[I0];
58:    const auto b_vec = b.get_thread_buffer().template get_as<BVec>()[I0];
59:    auto c_vec       = c.get_thread_buffer().template get_as<CVec>()[I0];
60:
61:    // c_vec += a_vec * b_vec
62:    WarpGemmAttribute{}(c_vec, a_vec, b_vec, bool_constant<post_nop_>{});
63:
64:    c.get_thread_buffer().template set_as<CVec>(I0, c_vec);
Inspect the actual MFMA input vectors:
(gdb) c -a
(gdb) p a_vec
$28 = {1, 1, 1, 1, 1, 1, 1, 1}
(gdb) p b_vec
$29 = {0.00012255, 3, 0.00012255, 3, 0.00012255, 3, 0.00012255, 3}
(gdb) p c_vec
$30 = {48.0097885, 48.0097885, 48.0097885, 48.0097885}
SMOKING GUN FOUND!
Vector |
Expected |
Actual |
Status |
|---|---|---|---|
|
All 1s |
|
Correct |
|
All 1s |
|
CORRUPTED! |
|
Should be 64 |
|
Wrong (due to b_vec) |
Conclusion: The A-matrix data is correct, but B-matrix data is corrupted before it reaches the MFMA instruction! Figure 4 below shows that the corruption happens earlier in the pipeline—in the tile registers stage.
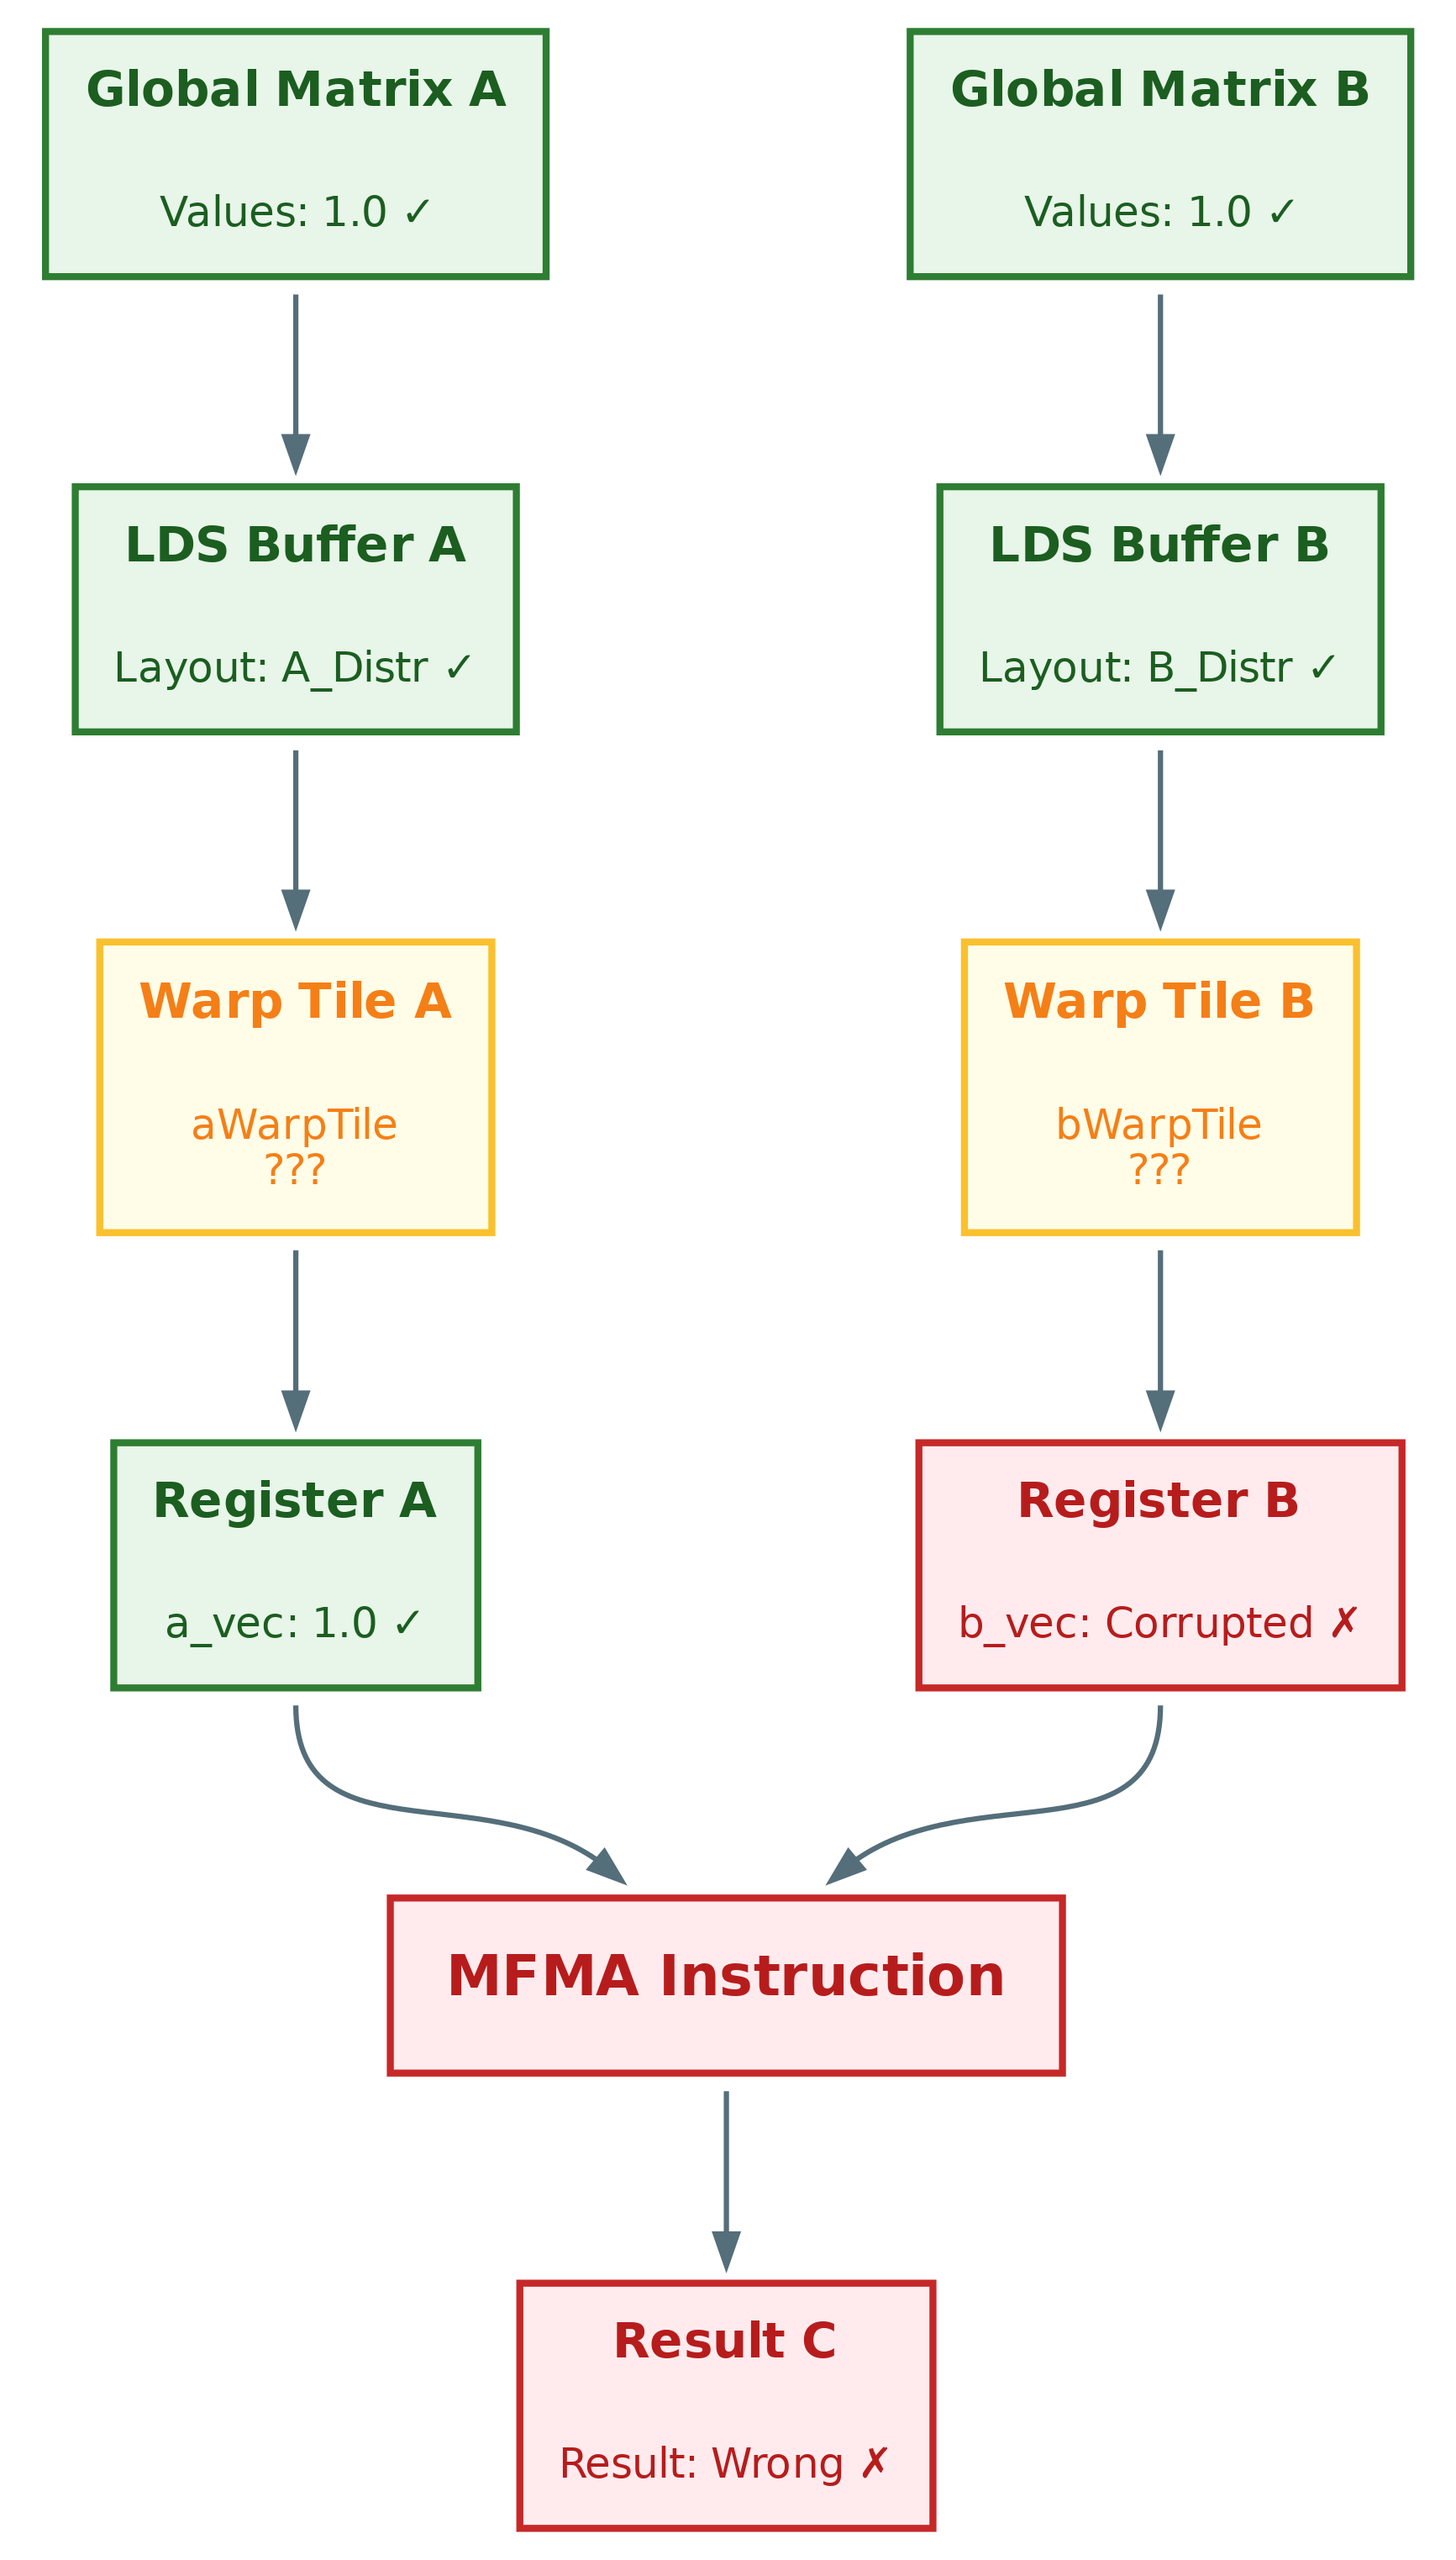
Figure 4: Data flow for GEMM after phase 3. Tile registers are suspicious#
Phase 4: Trace Back to the Source#
Where does b_warp_tensor get its data? Looking at the code:
201:    // read B warp tensor from B block tensor
202:    BWarpTensor b_warp_tensor;
203:    b_warp_tensor.get_thread_buffer() = bWarpTile.get_y_sliced_thread_data(
204:        merge_sequences(sequence<nIter, kIter>{}, b_warp_y_index_zeros),
205:        merge_sequences(sequence<1, 1>{}, b_warp_y_lengths));
So b_warp_tensor is sliced from the bWarpTile member variable. Where is bWarpTile populated?
The LocalPrefetch function:
104:    // Prefetch from LDS to warp register
105:    template <typename ASmemBlockWindow, typename BSmemBlockWindow>
106:    CK_TILE_DEVICE void LocalPrefetch(const ASmemBlockWindow& a_block_window,
107:                                      const BSmemBlockWindow& b_block_window)
108:    {
109:        aWarpTile = load_tile(a_block_window);
110:        bWarpTile = load_tile(b_block_window);  // Loading B data here
111:    }
Let’s check the member variable declarations:
 95:    using ALdsTile = decltype(make_static_distributed_tensor<ADataType>(ALdsTileDistr));
 96:    using BLdsTile = decltype(make_static_distributed_tensor<BDataType>(BLdsTileDistr));
 97:
 98:    ALdsTile aWarpTile;
 99:    ALdsTile bWarpTile;  // TYPO FOUND!
Root cause identified! Line 99 uses ALdsTile instead of BLdsTile for the bWarpTile declaration. This single-character typo is the source of our corruption, as illustrated in Figure 5 below.
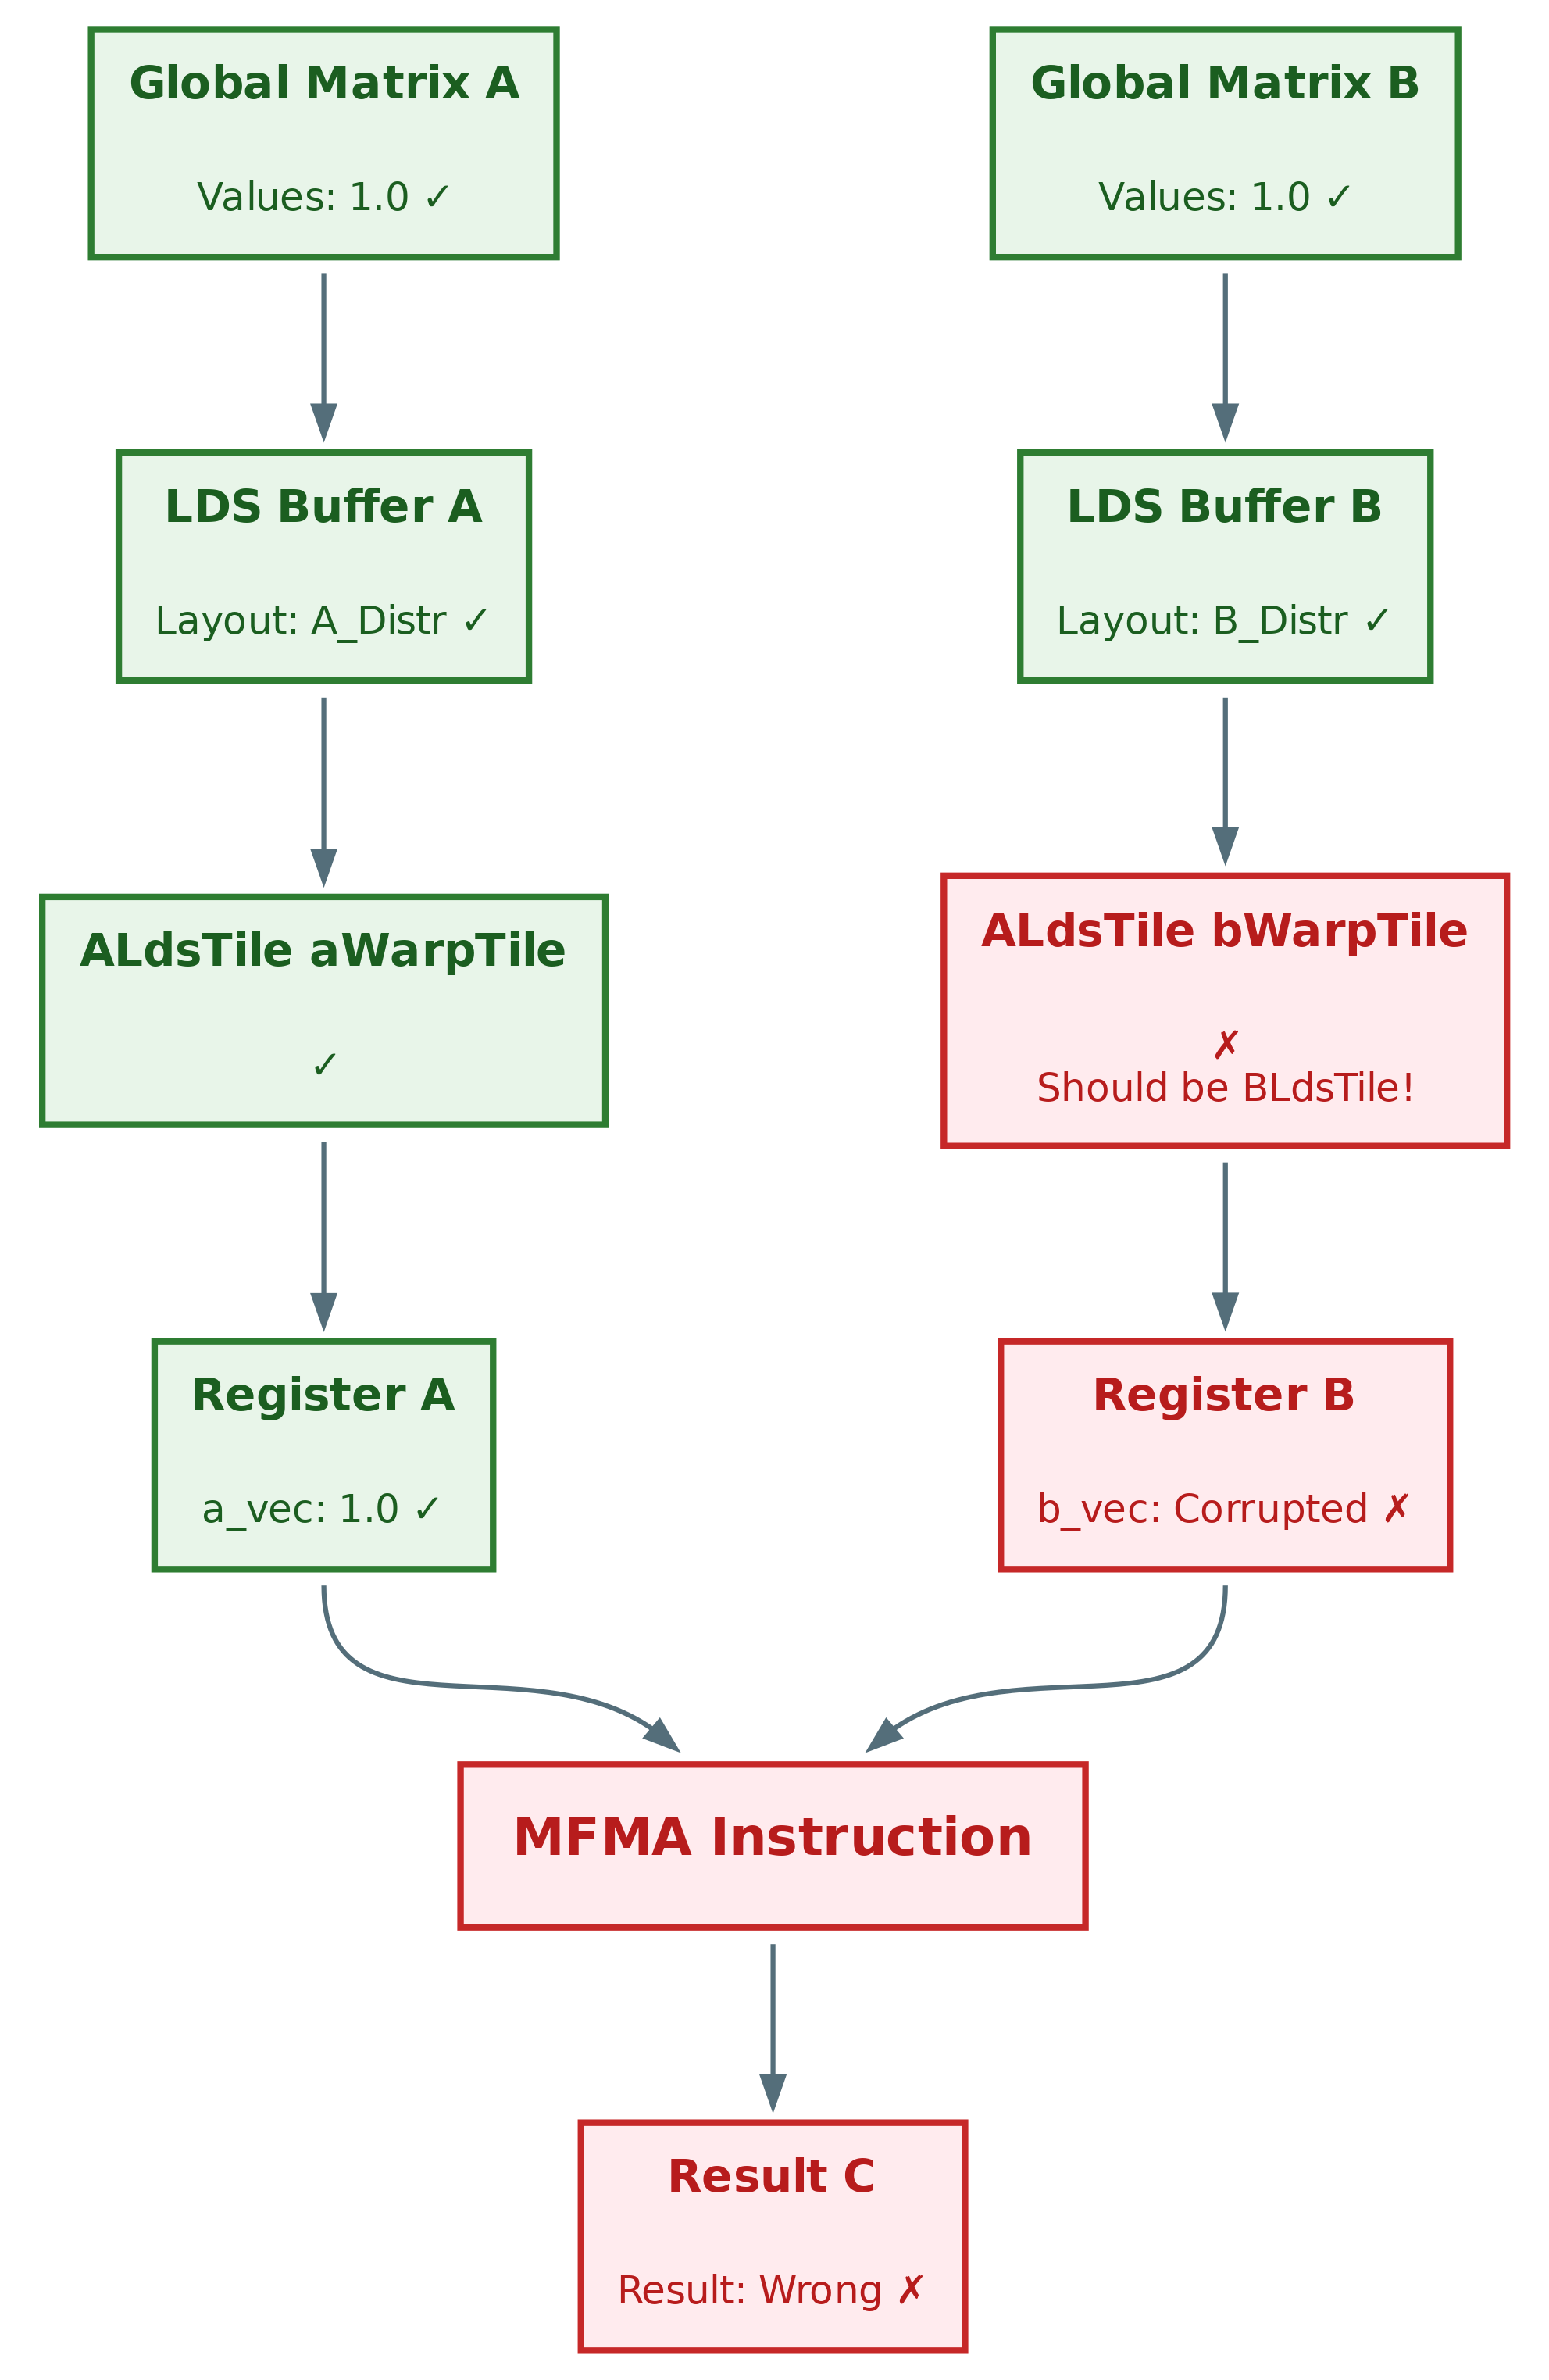
Figure 5: Data flow for GEMM after phase 4. Root cause is the one-character typo#
Root Cause Analysis#
The bug was a one-character typo in the type declaration:
// Line 99 - The Bug:
ALdsTile bWarpTile;  // WRONG! Should be BLdsTile
This single character difference (A vs. B) caused a cascade of problems:
Type Mismatch:
bWarpTilewas declared withALdsTile(A-matrix distribution) instead ofBLdsTile(B-matrix distribution)Different Distributions: The A and B matrices have different tile distributions:
A: Distributed across
NWarpdimension (for different M-iterations)B: Distributed across
MWarpdimension (for different N-iterations)
Memory Layout Corruption: When
load_tile(b_block_window)stored B-matrix data intobWarpTile:bWarpTile = load_tile(b_block_window); // Line 110
The data was stored using B’s correct layout (from
b_block_window)But
bWarpTilewas allocated with A’s layout (wrong type)This caused a layout mismatch
Data Corruption on Read: When slicing
b_warp_tensorfrombWarpTile:b_warp_tensor.get_thread_buffer() = bWarpTile.get_y_sliced_thread_data( merge_sequences(sequence<nIter, kIter>{}, b_warp_y_index_zeros), merge_sequences(sequence<1, 1>{}, b_warp_y_lengths));
The slicing operation expected B’s layout
But
bWarpTileactually had A’s layoutThis caused reading from wrong memory offsets
The Fix#
One-line change in block_gemm_asmem_bsmem_creg.hpp:
  using ALdsTile = decltype(make_static_distributed_tensor<ADataType>(ALdsTileDistr));
  using BLdsTile = decltype(make_static_distributed_tensor<BDataType>(BLdsTileDistr));

  ALdsTile aWarpTile;
- ALdsTile bWarpTile;
+ BLdsTile bWarpTile;
Data Flow Diagram (After Fix)#
After applying the fix (BLdsTile bWarpTile), all data flows correctly through each stage of the pipeline. Figure 6 below shows the corrected data flow with all stages properly validated:
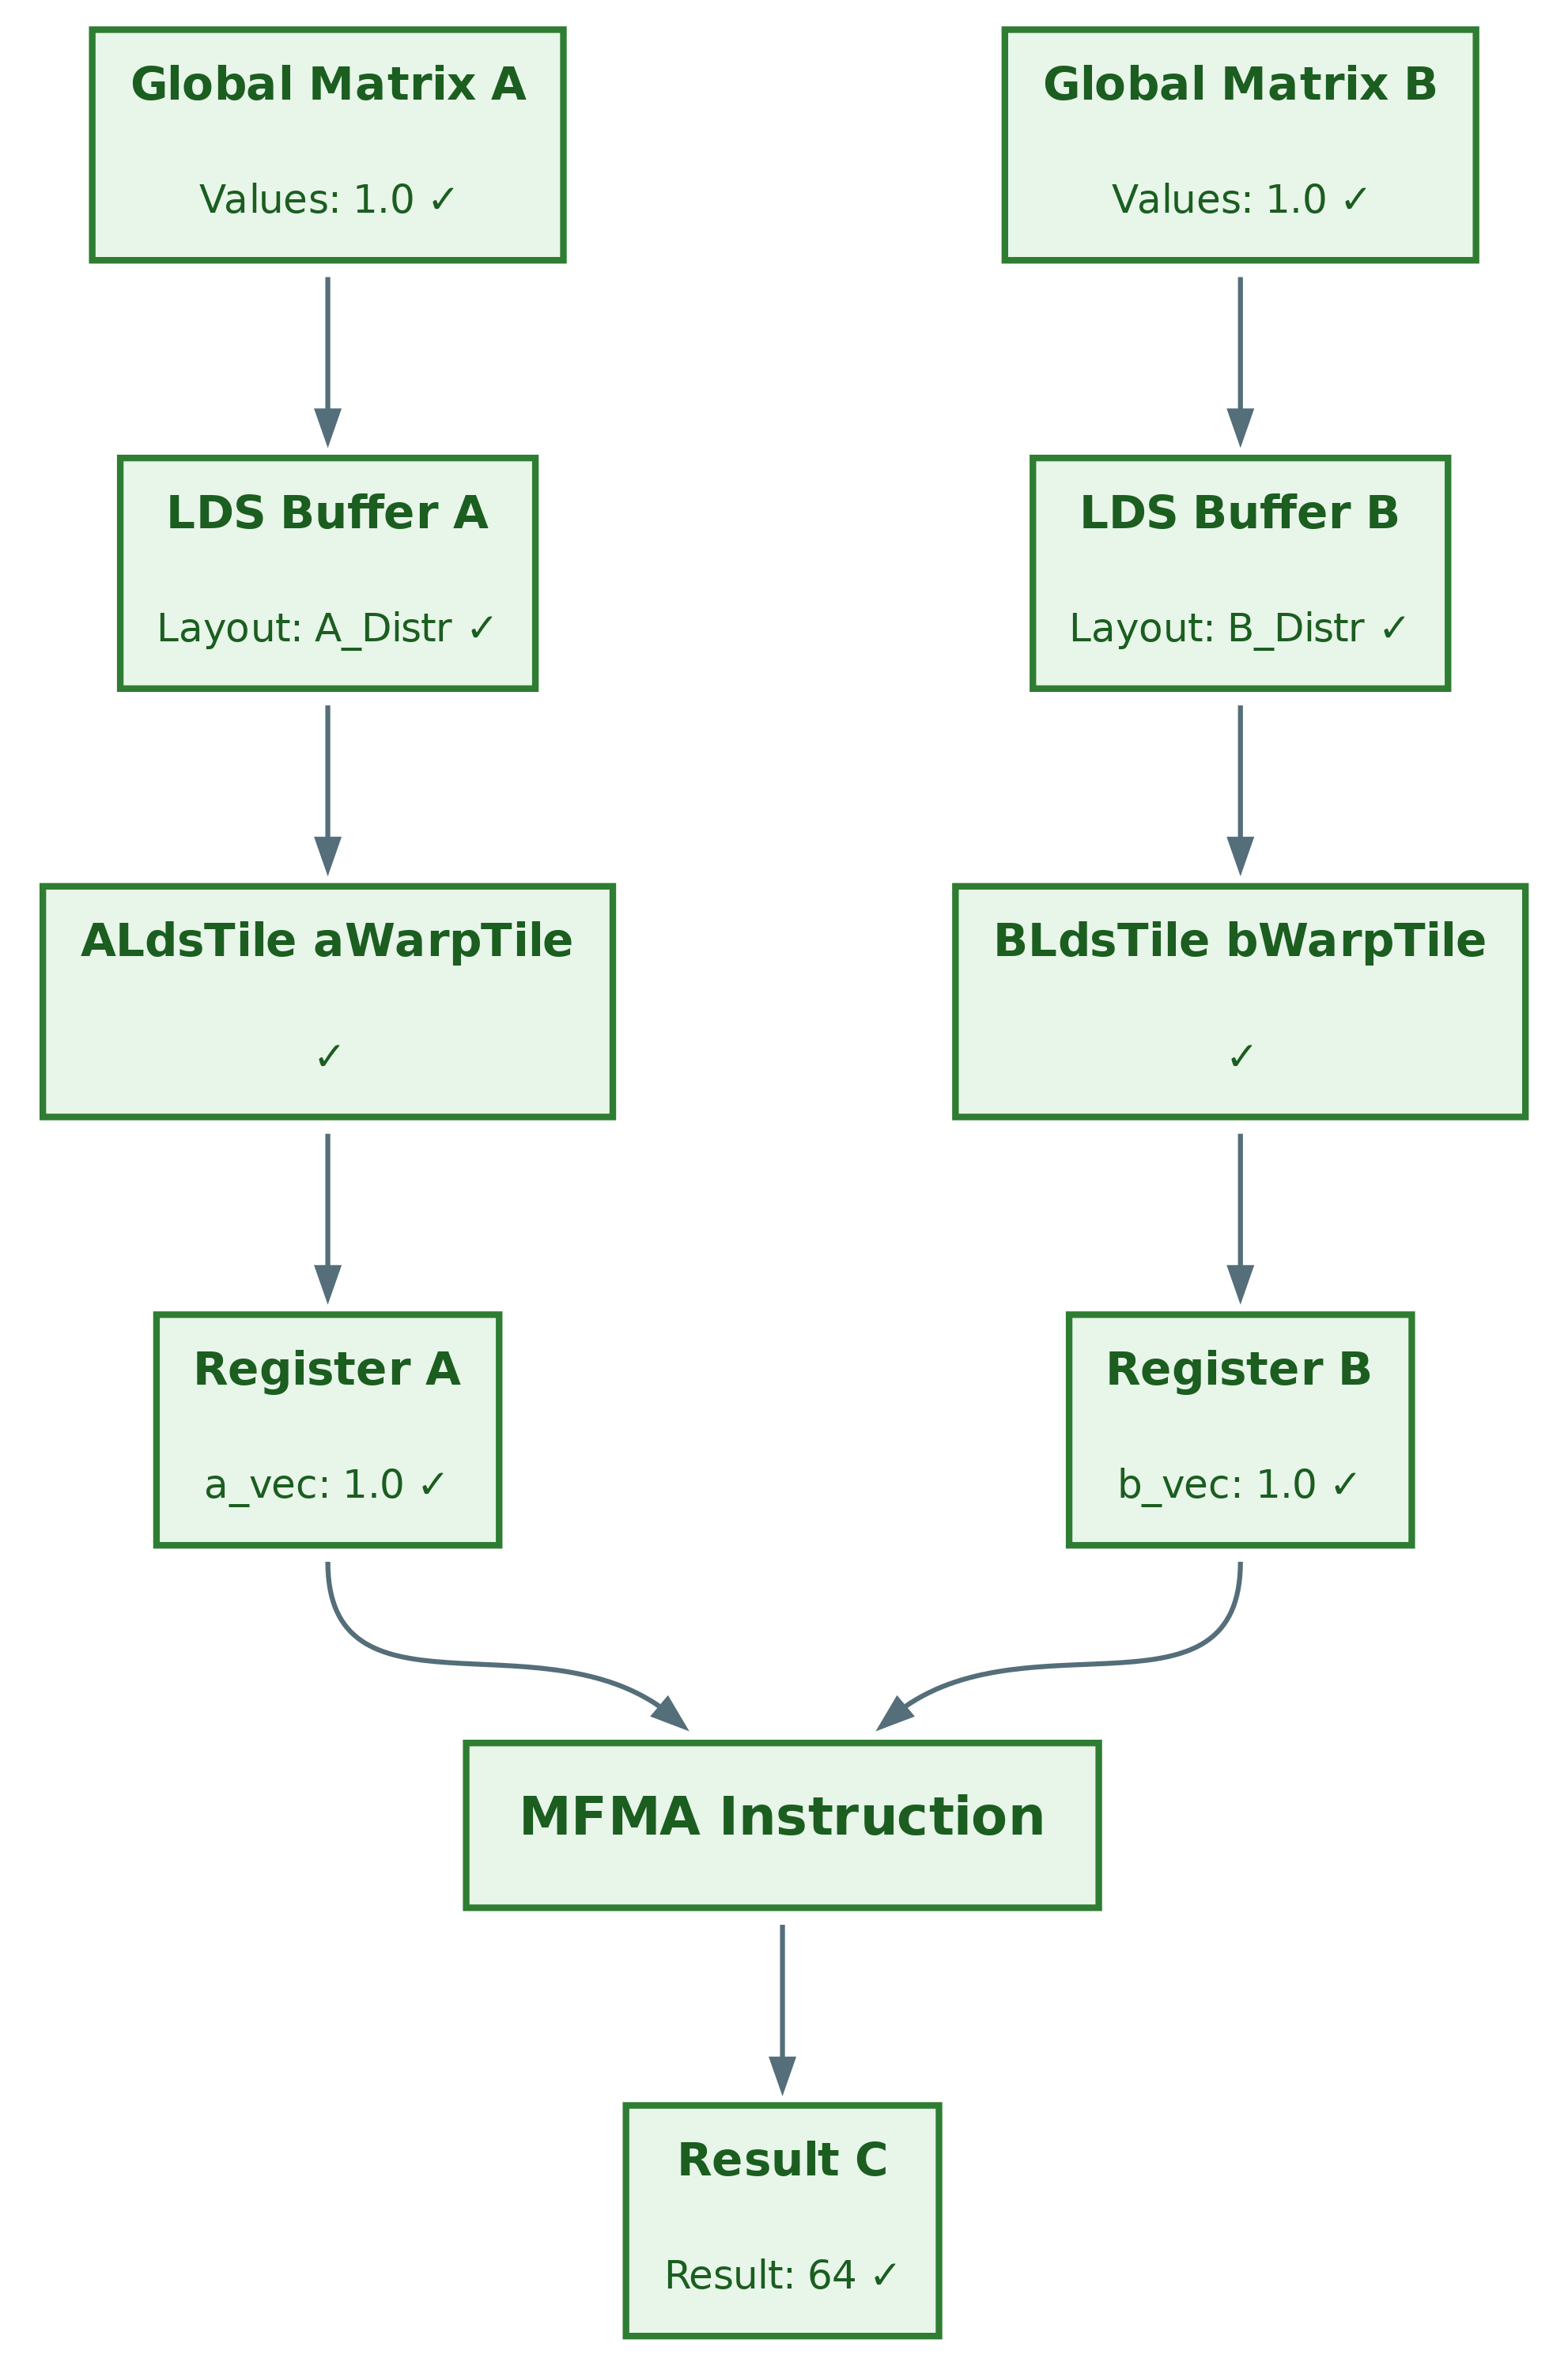
Figure 6: Data flow for GEMM after the fix#
Verification#
Test 1: Simplified Case (M=128, N=128, K=64, inputs=1)#
After fix:
*** Kernel G test ***
--> Using mfma_16x16x(16x2)
--> Enable prefetch
--> Enable instruction schedule
grid size 1
valid:y  ✓
Perf: 243.934 ms, 8.59721e-06 TFlops, 0.000268663 GB/s
All outputs are now 64, as expected!
Test 2: Original Problem Size (M=3328, N=4096, K=4096)#
Before fix:
grid size 832
max err: inf, number of errors: 10221412, 74.98383% wrong values
valid:n
Perf: 0.727292 ms, 153.541 TFlops, 121.107 GB/s
After fix:
grid size 832
valid:y  ✓
Perf: 0.763093 ms, 146.337 TFlops, 115.425 GB/s
Perfect! All results correct with similar performance!
Key Takeaways#
1. Simplify First, Debug Second#
The most effective debugging technique was simplifying the problem before using any debugger:
Reduce the problem size (832 blocks → 1 block) to isolate behavior
Use simple inputs (all 1s) to make expected outputs predictable
This transforms a chaotic bug into a deterministic, traceable issue
2. Work Backwards from Symptoms#
Trace the data flow in reverse to locate the corruption point:
Wrong output → Wrong GEMM result → Corrupted MFMA inputs → Wrong tensor distribution
Validate each stage with the debugger before moving to the next
The bug is usually where correct data first becomes incorrect
3. rocgdb Enables Deep GPU Inspection#
AMD’s rocgdb provides essential capabilities for kernel debugging:
Thread-level variable inspection on device code
Register and memory buffer dumps
Non-stop mode for controlling GPU threads
Breakpoints inside deeply nested template code
4. Type Aliases Can Hide Dangerous Bugs#
In template-heavy code like CK Tile, type aliases create subtle pitfalls:
ALdsTileandBLdsTileare both valid types with different tensor distributionsThe compiler accepts either—no error, no warning
A single-character typo (
AvsB) caused complete data corruptionConsider using distinct wrapper types or static assertions for critical type relationships
5. Layout Mismatches Cause Silent Corruption#
Tensor distribution bugs are particularly insidious:
Data loads correctly but is interpreted with the wrong layout
Corruption occurs during read, not write
Symptoms (NaN, wrong values) appear far from the root cause
Optimizations like instruction scheduling can amplify the visibility of such bugs
Summary#
In this blog, you learned how to systematically debug a subtle GPU kernel bug by tracing mysterious NaN outputs to a single-character typo (ALdsTile instead of BLdsTile) that caused the tensor distribution mismatch. Specifically, you learned how to:
Simplify complex bugs by reducing problem size and using predictable inputs, transforming chaotic failures into deterministic, traceable issues
Use rocgdb for GPU debugging, including setting breakpoints in device code, inspecting thread-local variables, and using non-stop mode for thread control
Trace data flow systematically by working backwards from incorrect outputs, validating each pipeline stage until pinpointing where corruption first occurs
Recognize tensor distribution bugs—a subtle class of issues where data loads correctly but is interpreted with the wrong memory layout
These techniques apply to debugging any complex GPU kernel, not just CK-Tile GEMM.
Continue Your Journey#
To deepen your understanding of rocgdb, CK-Tile, and AMD GPU kernel development, explore these related resources:
rocgdb documentation: Dive deeper into AMD’s GPU debugger with comprehensive command references and advanced usage patterns.
AMD matrix cores: Understand the MFMA instructions at the heart of accelerated matrix multiplication on AMD GPUs.
Avoiding LDS Bank Conflicts on AMD GPUs with CK-Tile: Learn how CK-Tile’s XOR-based swizzle eliminates LDS bank conflicts—another critical optimization technique for high-performance GEMM kernels.
Composable Kernel documentation: Learn more about CK’s tile-based programming model for high-performance GPU kernels.
Composable Kernel GitHub: Explore the CK library source code and contribute to the project.
Source code for this blog: Reproduce the debugging session yourself with the toy example.
Stay tuned for more debugging stories and optimization techniques from our team as we continue pushing the boundaries of GPU kernel performance on AMD Instinct accelerators.
Final thought: In high-performance GPU programming, the devil is in the details—and sometimes that detail is just one character.
Appendix: Useful rocgdb Commands#
# Launch debugger
rocgdb ./your_binary

# Enable non-stop mode for better thread control
(gdb) set non-stop on

# Set breakpoint at line
(gdb) b file.cpp:line_number

# Run the program
(gdb) r

# Continue all threads
(gdb) c -a

# Switch to specific thread
(gdb) thread <thread_id>

# Print variable/expression
(gdb) p variable_name

# Print with type information
(gdb) ptype variable_name

# Show all threads
(gdb) info threads

# Backtrace
(gdb) bt

# Step into function
(gdb) s

# Next line (step over)
(gdb) n
This debugging session was performed on AMD MI300X with ROCm 6.4. The techniques described here apply to debugging any GPU kernel with complex data layouts.
Disclaimers#
Third-party content is licensed to you directly by the third party that owns the content and is not licensed to you by AMD. ALL LINKED THIRD-PARTY CONTENT IS PROVIDED “AS IS” WITHOUT A WARRANTY OF ANY KIND. USE OF SUCH THIRD-PARTY CONTENT IS DONE AT YOUR SOLE DISCRETION AND UNDER NO CIRCUMSTANCES WILL AMD BE LIABLE TO YOU FOR ANY THIRD-PARTY CONTENT. YOU ASSUME ALL RISK AND ARE SOLELY RESPONSIBLE FOR ANY DAMAGES THAT MAY ARISE FROM YOUR USE OF THIRD-PARTY CONTENT.