Performance Profiling on AMD GPUs – Part 5: Profiling-Driven Kernel Optimization with an AI Code-Assist Tool#

In this fifth installment of the Performance Profiling on AMD GPUs blog series, the focus shifts from tutorial format to a worked end-to-end case study: driving the iterative optimization of a double-precision HIP kernel on an AMD Instinct™ MI250 Graphics Compute Die (GCD), using the same profiling workflow that the earlier parts covered, combined with a modern AI code-assist tool to keep the per-experiment loop tight. Parts 1, 2, and 3 of the series covered the foundations of GPU performance profiling and basic and advanced usage of the ROCm profiling toolkit (see Additional Resources below); Part 4 applied that toolkit to a Fortran code with OpenMP offload.
AMD Instinct™ GPUs are routinely deployed for HPC and AI workloads that benefit from hand-tuned kernels. Producing those kernels has traditionally involved long, manual cycles of profiling, hypothesis formation, code edits, validation, and documentation. Modern AI code-assist tools integrated with the developer’s editor and shell can compress that cycle significantly, provided the workflow is structured to keep the developer in control of correctness, direction, and measurement.
This post describes a concrete end-to-end workflow for iteratively optimizing a double-precision HIP kernel running on a single Instinct MI250 GCD, using Cursor’s agent mode as the code-assist tool. The workflow produced a cumulative 28.3× speedup[1] across roughly 45 recorded experiments while maintaining bit-identical results at 1e-12 relative tolerance at every step. The entire sequence — including planned reverts, a scaling-characterization pause, and post-mortem documentation — spanned roughly four working days of developer time; in a pre-AI-assist workflow of manual edit, build, profile, and diff cycles, the same progression would typically have taken weeks to months.
The emphasis is not on the kernel-specific wins or on a step-by-step recipe for the reader to reproduce, but on the pattern of prompts, tool commands, and guardrails that made the workflow productive and that generalize to other kernels, other projects, and other GPU architectures (the kernel optimizations themselves are tuned to MI250 and the gfx90a / CDNA2 instruction set architecture (ISA); the workflow does not depend on the device) — including the experiments that regressed and were reverted, which are as instructive as the ones that were kept. Each Pattern section ends with a bolded Generalizable lesson; the prompts in between are what ground them.
The intended audience is HPC and scientific-application developers who are already comfortable with HIP and ROCm profiling tools (see the ROCm profiling guide series in Additional Resources below) and want a practical template for incorporating an AI code-assist tool into the optimization loop.
The Example: A Stiff-ODE Solver on a Sparse Update Graph#
The kernel used in this study comes from a stiff ordinary-differential-equation (ODE) solver — that is, a numerical integrator for a system of coupled rate equations where the fastest and slowest components evolve on very different timescales, which forces the use of small, fixed-size timesteps. For each of N independent zones, the kernel integrates such a system representing on the order of 10^2 state variables coupled through on the order of 10^3 sparse coupling terms, forward in time through many thousands of those timesteps per zone. Each timestep evaluates coupling rates, accumulates per-state positive and negative update contributions, and performs an explicit state update.
Relevant structural details:
Every zone is independent, so zones map naturally to thread blocks.
The per-timestep working set (coupling rates, per-state accumulators, state variables, coupling-to-state index maps) easily exceeds register files, so the kernel relies heavily on Local Data Share (LDS, also known as shared memory).
Two loops dominate execution time: the rate-evaluation loop over all coupling terms and the state-update loop over all state variables, each with a variable number of contributing coupling terms (ragged, from a handful to several hundred per state variable).
Correctness is anchored by a numerical diff against a reference output at 1e-12 relative tolerance. This is the discipline that makes rapid iteration possible: any change that perturbs the result beyond that threshold is reverted immediately.
Experiments are launched via Slurm (sbatch) against a single MI250 GCD. The canonical timing configuration is 104 zones × 2 iterations: the 104-zone count matches the 104 compute units (CUs) on one GCD (one zone per CU), and two iterations are enough to amortize launch and copy overhead while keeping per-experiment turnaround short. A longer configuration — 14 iterations at the same zone count — is used only for detailed hardware-counter profiling under rocprof-compute, whose iteration-multiplexing option collects different performance monitoring counter (PMC) subsets across separate kernel launches and benefits from a larger invocation count to produce stable per-counter aggregates (iteration multiplexing is planned for a future ROCm release; readers on ROCm 7.2.0 can run the same profiling flow without it). Timings reported below are GPU-side wall-clock under the canonical 2-iteration configuration.
The starting baseline for this study was 46.7 seconds at 104 zones. The final kept configuration, after the experiments described here, ran in 1.65 seconds — a cumulative 28.3× speedup[1], bit-identical to the baseline.
The AI Code-Assist Tool#
Cursor is an IDE built on VS Code that exposes a chat-based agent with full access to the workspace file system, terminal, and tool-invocation APIs. In agent mode the assistant can read files, run shell commands (including Slurm submissions), edit source files, and report back — while the developer reviews each substantive action in the usual diff and terminal panes. For this project, the IDE ran on the developer’s laptop and connected over remote-SSH to the HPC node where the source tree, build system, and MI250 GCD lived; all sbatch builds, runs, profiling invocations, and git operations executed on the remote node. The agent’s underlying model was Anthropic’s Claude Opus 4.7 (high-reasoning mode).
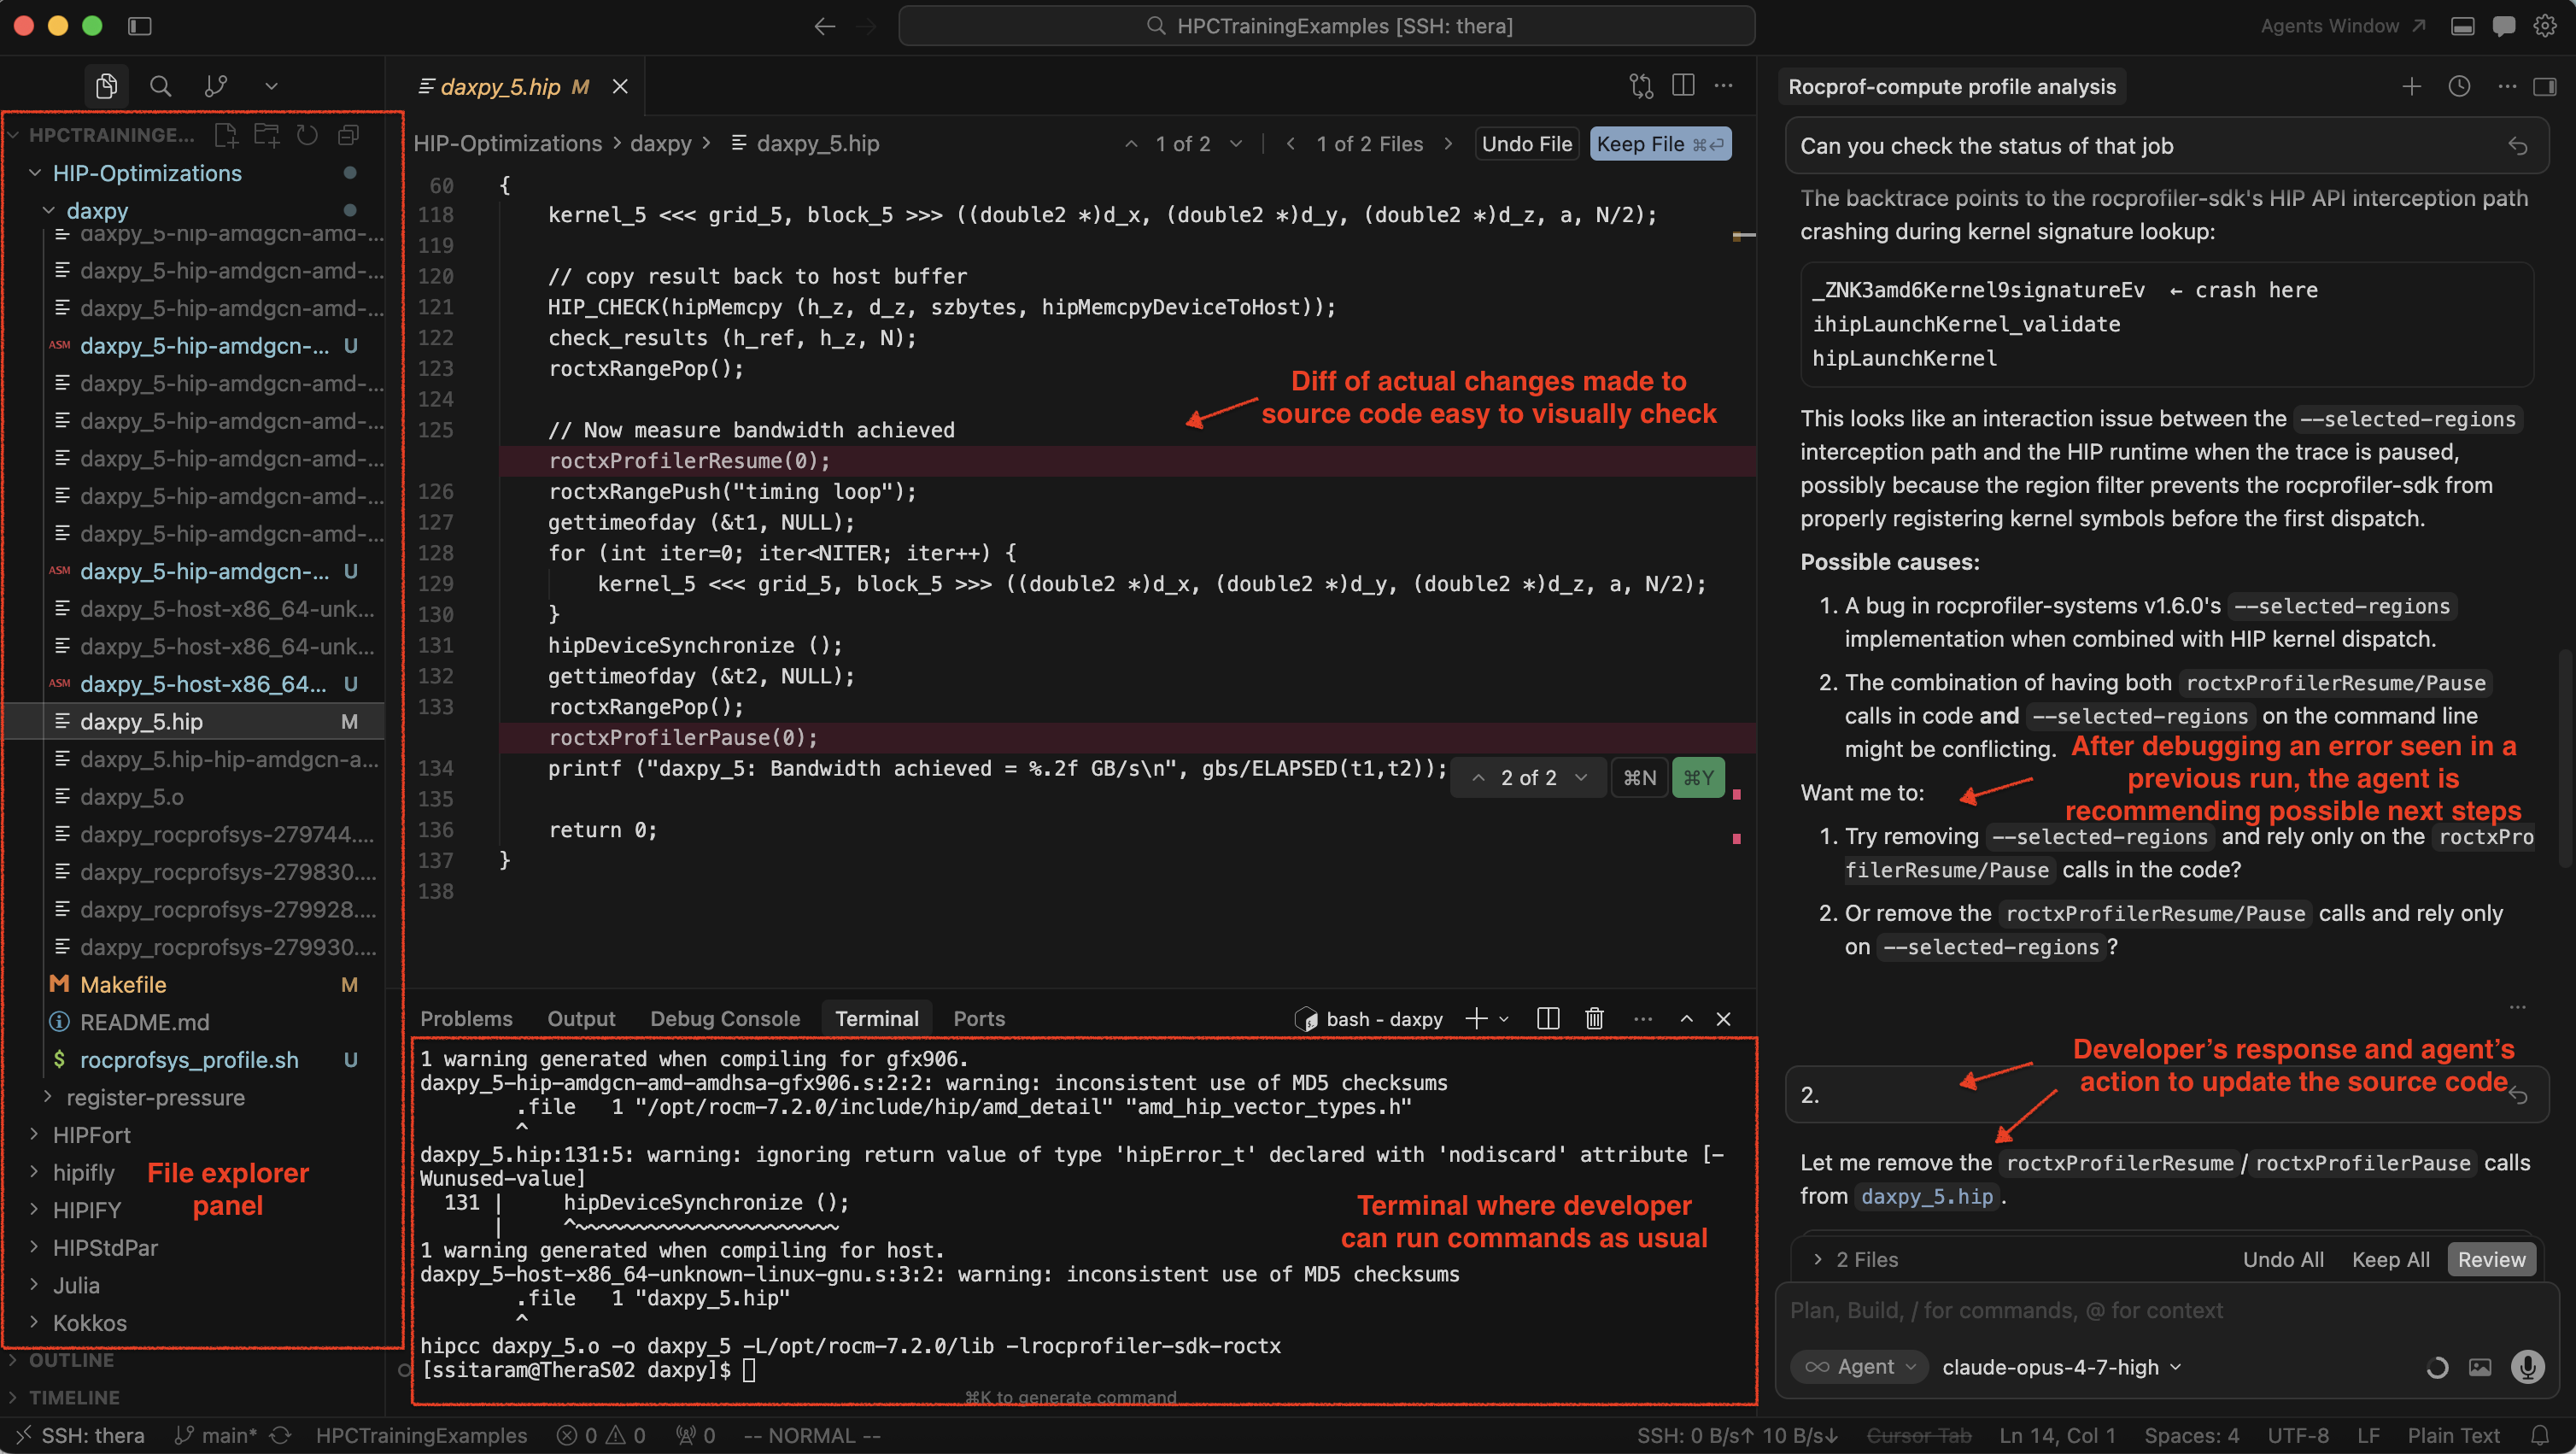
Three properties of the tool mattered most for the workflow described here:
A shared log file. All experiment plans, hypotheses, measured results, and revert decisions were written into a single
experiment_log.mdby the agent. Across 45 experiments spanning several days, this log replaced the developer’s own memory of what had already been tried.Non-destructive git behavior. The agent created feature branches and wrote commit messages to a text file, but the final
git commitandgit pushwere executed by the developer from their own shell. This kept SSH authentication, sign-off, and remote pushes under the developer’s explicit control.Arbitrary shell and tooling invocation. Submitting
sbatch build.sh, pollingsqueue, extracting vector general-purpose register (VGPR) counts from arocprofv3CSV, and running a numericaldiffagainst a reference output are all shell operations the agent performs autonomously once the commands are established.
The rest of this post walks through a representative sequence of prompts and the outcomes they produced. Each example is generalizable; the specific kernel details are incidental.
Setting Up the Environment and Baseline#
The first session fixed the baseline, the reproducible build and run commands, and the correctness check. Two prompts were enough to establish the loop.
Prompt 1. Set up Slurm sbatch scripts that build this project with
CMAKE_BUILD_TYPE=Release,ENABLE_GPU=ON, andCMAKE_HIP_ARCHITECTURES=gfx90aon an MI250 node, run the produced binary with<zones> <iterations>arguments on one GCD, and wrap the run underrocprofv3/rocpdand underrocprof-computeso the same command line can be reused for profiling later.
The agent produced build.sh, run.sh, profile.sh (for rocprofv3 and rocpd commands), and compute_profile.sh (for rocprof-compute commands), all with appropriate #SBATCH directives (-p MI250, --gres=gpu:1, module load rocm/7.2.0). These four scripts remained unchanged for the duration of the project.
Prompt 2. Run the baseline at 104 zones × 2 iterations and record the result as the canonical reference output. After every subsequent experiment, diff the new state-variable table and the auxiliary-rate diagnostic against this reference; any difference beyond 1e-12 relative tolerance is a regression, not a speedup.
From that point onward the developer’s cadence was simple: propose an experiment, the agent builds and runs it, the agent writes the keep/revert decision in experiment_log.md. The 1e-12 correctness check is what makes this cadence safe at speed.
The arc of the project in numbers. Because the patterns described below draw from all stages of the project rather than following experiment order, the following chronological skeleton is useful to keep in mind:
Phase |
Experiments |
Dominant technique |
Wall time at phase end |
|---|---|---|---|
1 |
E01–E19 |
LDS staging of reused inputs |
46.7 s → 26.5 s |
2 |
E20–E28 |
divergence reduction (wave-cooperative reductions) |
26.5 s → 13.2 s |
3 |
E29–E41 |
block-size, sub-wave packing, arithmetic refactors |
13.2 s → 1.65 s |
4 |
E42–E45 (plus abandoned E46) |
attempts to cross the 2-blocks-per-CU occupancy gate |
regressed, abandoned at 1.65 s |
Between Phase 1 and Phase 2 a collaborator’s branch was merged into the optimization branch; the merge preserved Phase 1’s cumulative speedup (the post-merge tip measured 26.5 s, bit-identical to the reference output) and added new code that the Phase 2 and Phase 3 experiments then built on. The “45 experiments” count includes both kept experiments and reverted ones.
A note on setup. No agent skills files (pre-loaded context files that prime the agent’s behavior) were used at any point in this project. The only structured context the developer provided before the experiment loop started was an initial reading of the first rocprof-compute analysis report, shared as a prompt immediately after the scripts were established:
Start a markdown file to note down some observations from the first analysis report. First, only 8 out of 104 CUs were given any work, so the GPU was not fully utilized. VALU Active threads was only 21 percent indicating significant thread divergence. Occupancy was also very low (4 waves per CU of a total of 32 possible), but there are no resources that hindered occupancy from table 6.2, indicating just low parallelism. There are some LDS bank conflicts too per 2.1.17. We hit 85% in L1 cache, and 100% in L2 — so the data being read is fitting in L2 cache.
This single prompt seeded experiment_log.md with the developer’s own reading of the profiler output and established the initial bottleneck hypotheses (low CU utilization, thread divergence, low occupancy) that shaped the first round of experiments. Everything from Prompt 3 onward was built on top of this shared starting point — no further priming of the agent’s context was needed.
The Core Prompt: Framing the Experiment Loop#
The single most consequential prompt of the whole project was the one that followed. It did three things at once: declared the agent’s role, described the loop, and set an explicit termination criterion. Everything that follows in this post is an unrolling of this one instruction.
Prompt 3. For this kernel, I’d like you to try valid optimizations that don’t break correctness in a loop such that each optimization yields better performance. You can stop after 5 unsuccessful attempts at improving performance. You are an expert at HIP kernel optimization on AMD GPU architectures. If you need to use
rocprof-computeto gather metrics, you can set the number of iterations in the host driver source to 14, but otherwise, you can set that to 1 for quick timing runs. It may be better to configure the number of iterations as an application runtime argument. When you work on optimizations, keep a summary document recording all the performance analysis and observations for each experiment. Use the information on resource usage, etc. fromrocprofv3kernel traces, etc. and analysis reports fromrocprof-computeto reason why performance is better or worse after applying said optimization.
Partway into the run, the termination threshold was extended:
Prompt 4. Keep trying until you reach 10 unsuccessful attempts. I want you to explore various types of optimizations.
A few elements of Prompt 3 are worth calling out individually, because each one did disproportionate work over the subsequent days:
“Valid optimizations that don’t break correctness” + “each optimization yields better performance” — these clauses tied every loop iteration to the 1e-12 reference diff from Prompt 2 and made the per-experiment success criterion binary: either wall time drops relative to the last kept configuration, or the experiment is reverted.
“You can stop after 5 unsuccessful attempts” — an explicit termination condition that required the agent to count consecutive failed experiments rather than continue indefinitely; the later bump to 10 (Prompt 4) pushed exploration into less-obvious categories after the first handful of tries had mostly reached for the same class of change.
“You are an expert at HIP kernel optimization on AMD GPU architectures” — a role declaration that meaningfully shifted the agent’s defaults toward
__restrict__, wave-cooperative primitives, VGPR / scalar general-purpose register (SGPR) / LDS budget reasoning, and ISA-level follow-ups, rather than generic suggestions.“Keep a summary document … and use
rocprofv3/rocprof-computeto reason why performance is better or worse” — together these clauses createdexperiment_log.mdand required every keep/revert decision to be justified by mechanism rather than by a wall-time delta alone, binding the quick-timing and the 14-iteration profiling configurations into one workflow.
Generalizable lesson. When handing an iterative optimization task to an AI code-assist agent, the framing prompt is doing more work than any individual experiment prompt. Pin the role, bound the correctness requirement, define the per-step success criterion, set a termination condition, require a durable log, and require mechanism-level reasoning — in one message, at the start. The rest of the interaction is then a sequence of small, targeted follow-ups rather than re-establishing context every time.
Pattern 1: Letting the Loop Compound a Single Working Technique#
The first sustained speedup streak emerged from the experiment loop without further prompting, but the loop did not start from a blank slate. Shortly after Prompt 3, the developer added two targeted suggestions to the candidate list:
Prompt 5. To your list of optimizations, you may want to add a check for whether there is an alternative to the
powfunction being used in the kernel and if there is, whether that helps reduce scalar and vector register pressure.Prompt 6. Also similarly for any
expfunction calls.
The agent located a pow(tmp, 1.0/3.0) call in the prologue and replaced it with cbrt(tmp) (E01); VGPR pressure and code size dropped but timing was a tie. The parallel exp audit found no double-precision substitution that preserved the 1e-12 tolerance. The next two agent-proposed experiments — removing a stale printf guard from the hot while loop (E02) and adding __restrict__ on all pointer parameters (E03) — both regressed despite static metrics improving. The agent’s own diagnosis, recorded in experiment_log.md, was that the kernel was latency-bound on global-memory gathers that were consulted in every time step, and not VALU-bound. That diagnosis set the direction for the next class of experiments, which were entirely autonomous.
The first successful experiment, E06, moved a per-zone rate-coefficient array from HBM into LDS:
The array is computed once per zone in the kernel prologue and then read on every iteration of the stiff-ODE
whileloop.In the baseline, each
whileiteration re-fetched every array element from HBM through the cache hierarchy, even though the values had not changed since the prologue.Staging the array into LDS once per block made every subsequent read an LDS load and dropped wall time by 0.70 % with bit-identical output — the first measurable speedup of the loop, and the start of an eight-experiment streak.
The pattern is mechanically simple. A unified view of the change — global pointer dereferenced inside the hot loop, replaced by an LDS slice filled once per block — is enough to convey the entire transformation:
__global__ void solver_kernel(
    /* ... */
    double* __restrict__ input_a_g,   // populated once per zone
    /* ... */)
{
+   extern __shared__ double smem[];
+   double* accum_b = smem;                          // NUM_TERMS
+   double* input_a = accum_b + NUM_TERMS;           // NUM_TERMS  <-- staged copy
+
+   for (int r = tid; r < NUM_TERMS; r += blockDim.x)
+       input_a[r] = input_a_g[r];                   // stage-in, once per block
+   __syncthreads();
+
    while (/* stiff-ODE timestep loop */) {
        for (int r = tid; r < NUM_TERMS; r += blockDim.x) {
-           double rr = input_a_g[r];                // HBM fetch every timestep
+           double rr = input_a[r];                  // LDS load
            // ... compute update contribution from term r ...
        }
    }
}
For the later experiments in the streak, the only thing that changed was the type of the LDS slice and the stage-in cast — for an integer-index array whose values fit in a byte, the LDS copy was declared unsigned char* and host-side assertions validated the value range. Narrower types kept the cumulative LDS footprint inside the 64 KB-per-CU budget even after seven arrays had been staged; the most aggressive packing co-resident a 12-bit index and a 4-bit factor in one 16-bit slot. Applied mechanically to every array with the same “written once per zone, read many times per timestep” access pattern, this produced the bulk of the cumulative speedup before any compiler- or algorithm-level change was needed:
Exp |
Array staged into LDS |
Type in LDS |
Δ vs previous |
Cumulative |
|---|---|---|---|---|
E06 |
coupling-rate scalars |
|
−0.70 % |
−0.70 % |
E10 |
per-term input count |
|
−0.80 % |
−2.21 % |
E11 |
per-term input index 1 |
|
−0.86 % |
−3.05 % |
E12 |
per-term input index 2 |
|
−0.40 % |
−3.44 % |
E13 |
per-term input index 3 |
|
−0.43 % |
−3.85 % |
E14 |
positive / negative contribution bounds |
|
−0.33 % |
−4.17 % |
E15 |
positive / negative contribution index maps |
|
−4.65 % |
−8.63 % |
E19 |
positive / negative integer weight-factor arrays |
|
−37.7 % (biggest single win of the LDS-staging streak) |
−43.2 % |
Generalizable lesson. Once the experiment loop has identified a class of refactor that lands a measurable win on one site, the most productive next move is often not to propose the next idea by hand — it is to let the loop find every other site where the same refactor applies. Across E06–E19 the developer did not propose any individual experiment.
The kernel-specific reading: when the static profiling view (occupancy, VGPR count, code size) looks fine but runtime is sluggish and changes that “should help” instead regress, the likely bottleneck is global-memory latency on reused inputs, and “written once per zone, read many times per timestep” arrays staged into LDS — with sub-word types where the value ranges allow — is the mechanical class of refactor that pays off.
Pattern 2: Knowing When to Stop — The Developer Cutting an Exhausted Line of Inquiry#
The experiment-loop rule from Prompt 3 (“stop after 5/10 unsuccessful attempts”) is mechanical. In practice, no phase of this project was ever ended by the counter. Every phase boundary was a developer decision, and the clearest instance came at the very end.
The kernel had reached 1.65 s per 104-zone/2-iteration batch at E41, a 28× improvement over the original baseline[1]. Two remaining occupancy gates had been identified — LDS footprint and VGPR/SGPR pressure — but neither would yield to a single lever. E44 cleared the LDS gate (44.6 KB → 19.6 KB) by moving the two largest hot LDS arrays to global memory; this alone regressed by +3.6–3.9 % because the VGPR/SGPR gates were untouched. E45 layered __launch_bounds__ and amdgpu_waves_per_eu on top of E44 to force the compiler toward the remaining gates; VGPR dropped only from 112 to 104, SGPR did not move at all, and wall time regressed by another +3.9 %. The agent was in the middle of writing the E45 post-mortem and preparing to propose E46 — a kernel-argument struct to collapse ~30 pointer parameters and relieve the SGPR wall — when the developer interrupted with a three-word prompt:
Prompt 18. actually abandon this.
That directive closed out the entire Phase 4 trio, including the unimplemented E46, and ended the optimization project.
Generalizable lesson. AI-assist loops are inherently biased toward continuing — the agent always has another plausible variant to try, and the 10-failure counter only protects against thrashing inside a given phase. It cannot distinguish “this technique is not paying off yet” from “this technique has hit a structural wall and no further parameter twiddle will clear it.” The developer, reading the same log the agent reads, is usually the first to see the wall. The human countermeasure is a short directive that collapses the search space to zero, and it matters that the prompt is short: a long argumentative prompt invites the agent to negotiate, while a three-word instruction leaves no room for a counter-proposal. The Phase 4 trio also became one of the most instructive entries in experiment_log.md exactly because it was walked away from. With full post-mortems for E44 and E45 and an explicit note that E46 was proposed-but-not-implemented, a future re-attempt of the same path will find the record before spending any hardware time on it.
Pattern 3: Pausing the Loop to Ask for Characterization, Not Another Experiment#
After the first long streak of positive experiments — driven largely by the LDS staging of Pattern 1 and the divergence-reduction work that followed — the kernel reached 1.650 s at 104 zones (E41, a cumulative 28.3× improvement over the 46.7 s baseline[1]). At this point the developer deliberately paused the experiment loop and asked for a characterization run rather than another proposal:
Prompt 7. After this experiment, let’s pause the loop. I would like to run with several problem sizes as seen in the existing parallel-run script and check whether we have to try different optimizations (or roll something back) in order to run more than 104 zones on a single GPU. I think we have optimized the kernel for running 104 zones which is one per CU of the GPU device we have. I wonder if some optimization is lying there to run 2×10⁴ zones or more on this GPU efficiently.
The concern was a legitimate overfitting worry: every experiment so far had been timed at exactly one zone per CU, and it was not obvious whether the LDS packing and sub-word types had been implicitly tuned to that ratio. The agent chose ten zone counts spanning 0.5× to 10× the CU count (52, 104, 156, 208, 260, 312, 416, 520, 780, 1040), submitted them as parallel sbatch jobs, and produced the following table (zone-sweep timings were collected in a separate batch of runs and may differ slightly from the canonical per-experiment measurements due to run-to-run variance):
zones |
zones/CU |
GPU time |
μs/zone |
efficiency |
|---|---|---|---|---|
52 |
0.5 |
1.657 s |
31 864 |
51.9 % |
104 |
1.0 |
1.721 s |
16 547 |
100 % (ref) |
156 |
1.5 |
3.357 s |
21 520 |
76.9 % |
208 |
2.0 |
3.433 s |
16 504 |
100.3 % |
260 |
2.5 |
5.061 s |
19 464 |
85.0 % |
312 |
3.0 |
5.142 s |
16 480 |
100.4 % |
416 |
4.0 |
6.857 s |
16 483 |
100.4 % |
520 |
5.0 |
8.563 s |
16 467 |
100.5 % |
780 |
7.5 |
13.601 s |
17 437 |
94.9 % |
1040 |
10.0 |
17.117 s |
16 458 |
100.5 % |
Two patterns in this table mattered:
Strong scaling is essentially perfect at exact multiples of 104. Per-zone cost stays at ~16.5 ms from 104 zones all the way to 1040, with efficiency within 0.5 % of the 104-zone reference. The Pattern 1 LDS-staging work was not overfit to one zone per CU; it generalized.
The partial-wave penalty is large. At 52 zones only half the CUs have work, and per-zone cost nearly doubles; at 156 and 260 zones (1.5× and 2.5× the CU count) the per-zone cost sits 30 % and 18 % above the floor because the last partial wave of blocks serializes against the first full wave. This is the expected block-per-CU quantization behavior, not a kernel-level regression.
The developer then asked for the ad-hoc commands to be captured as reusable scripts:
Prompt 8. Can you put the actual commands you used to run the sweep and now this tabulation of the sweep results in a script?
Prompt 9. Use sbatch directives as well.
Prompt 10. Please document all this in a markdown.
These produced scripts/zone_sweep.sbatch (a Slurm array job over the ten zone counts), scripts/tabulate_zone_sweep.sh (which reads the per-array-task output and emits the Markdown table above), and zone_sweep_analysis.md — all version-controlled and rerunnable against future kernel versions. zone_sweep_analysis.md also recorded the bottleneck hypothesis that shaped subsequent experiments: LDS at ~44.6 KB per block was keeping the kernel at 1 block per CU, and the 32 KB-per-block threshold needed to fit 2 blocks per CU on gfx90a had not been crossed.
Generalizable lesson. A productive optimization loop benefits from periodic step-back prompts that request characterization rather than more experiments. Pause, sweep the parameter that the previous experiments were held constant over, tabulate, summarize is a clean multi-step task, and an AI code-assist agent handles it well. It also produces artifacts — scripts under scripts/, analyses under version control — that remain useful to the next person reading the repository, independently of the optimization loop itself.
Pattern 5: Diagnosing Outcomes with Generated Assembly and Profiler Reports#
Wall time and numerical diffs are necessary but often insufficient to explain why an experiment did or did not deliver the expected gain. A bit-identical kernel can still miss a projected speedup because the compiler declined to emit the intended instructions — or regress because the compiler emitted extra ones (cleanup, epilogues, spill code) that the source change did not make explicit. Inspecting the generated gfx90a ISA per experiment distinguishes “the source change never reached the binary” from “the binary changed but the timing did not move for some other reason.”
This was the most frequently developer-initiated category of prompt. Early in the first loop, before any optimization had been tried, the developer asked directly for the kernel’s assembly:
Prompt 14. Pull up the assembly file generated for this kernel after the last build.
The agent’s first attempt found no .s files under the build tree. The developer followed up:
Prompt 15. I generated them using the
-g --save-tempsoptions added to hipcc just now. What happened to them? Look for.sfiles in the build directory.
The root cause was that --save-temps had been added to CMAKE_HIP_FLAGS_RELEASE, but the build tree was using the default RelWithDebInfo type, so the flag was never applied. Fixing it was a one-line addition of -DCMAKE_BUILD_TYPE=Release to the build script — a useful reminder that build-system questions are a realistic failure mode for AI code-assist tools, and that the developer’s concrete knowledge of which knob was changed, and where, is often what closes the gap.
With .s files actually being generated per build, the developer immediately asked an architectural question of the ISA:
Prompt 16. Now, here is the assembly. Where is the scratch spill and reload happening?
There turned out to be none — according to the assembly metadata, the compiler allocated 117 VGPRs and 100 SGPRs at 4 waves per single instruction, multiple data (SIMD) unit with zero scratch bytes. That single prompt returned an answer that, in earlier development cycles, would have required manually parsing the same metadata.
The ISA inspection also guided the very first structural change of the loop. The baseline kernel contained a pow(tmp, 1.0/3.0) call, and the agent’s .loc-annotated walk of the assembly revealed that this single call had expanded into roughly 335 lines of gfx90a instructions — the compiler had inlined the general-purpose pow implementation rather than recognizing the cube-root special case. Replacing it with cbrt(tmp) collapsed that expansion into a much shorter sequence, dropped VGPR pressure from 117 to 103, and shrank code size by roughly 8 % — the concrete mechanism behind what would otherwise have been a mysterious “changed a one-liner, kernel got smaller.”
The same workflow was used again after merging in a colleague’s divergent branch:
Prompt 17. I would like to collect a rocprof-compute analysis and check what the assembly indicates at this time. With all that new info, I’d like you to resume your experiment loop and focus on what optimizations may help at this point. Maybe the focus now has to be avoiding thread divergence. It may be worthwhile to check some changes pushed into a collaborator’s branch to see if they are useful.
This single prompt put three inputs in front of the agent simultaneously — a full rocprof-compute analyze report (run via compute_profile.sh at 14 iterations with iteration multiplexing, against the post-merge tip at 26.5 s), the updated .s file, and the collaborator-branch diff — with a specific hypothesis (thread divergence) to test. The agent distilled the report into the following diagnostic summary:
Metric |
Value |
Interpretation |
|---|---|---|
VALU Active Threads |
9.59 / 64 (15 %) |
severe intra-wave divergence |
VALU Utilization |
5.33 % |
ALU mostly idle |
IPC (instructions per cycle) |
0.12 / 5.0 |
wavefronts stalled on something |
Wavefront Occupancy |
410 / 3328 (12.3 %) |
low |
L2-Fabric BW |
0 Gb/s |
HBM traffic eliminated by LDS staging |
L2 Hit Rate |
98 % |
cache behavior already good |
LDS Bank Conflicts / Access |
0.13 |
minimal |
LDS Allocation |
51 374 B / block |
caps occupancy, together with VGPRs |
Branch Utilization |
0.75 % |
low frequency, but each branch diverges the wave |
The synthesis — kernel is divergence-bound, not memory-bound or compute-bound — confirmed the developer’s hypothesis and pointed the next round of experiments at the 15 % active-thread rate rather than at further cache tuning.
Two experiments in that round produced the largest single-step wins of the entire project. The first was a wave-cooperative state-update reduction: the baseline inner reduction over each state variable’s contributing coupling terms had been a scalar loop running only on lane 0, with the other 63 lanes idle. The agent rewrote it as a 64-lane parallel reduction using __shfl_down across the wave; wall time dropped from 26.5 s to 13.2 s — a −50.1 % single-experiment improvement, bit-identical to the reference output. The second was an increase in block size from 256 to 1024 threads (4 → 16 waves per block); because the wave-cooperative reduction had been written against a runtime-variable wave count (nw = blockDim.x >> 6), only the host-side launch parameter changed. Wall time dropped from 13.2 s to 7.5 s to 6.4 s as block size moved through 4, 8, and 16 waves. The rocprof-compute before/after comparison made the mechanism concrete:
Metric |
4 waves/block |
16 waves/block |
|---|---|---|
Wavefront occupancy (% of peak) |
9.0 % |
49.7 % |
IPC |
0.35 |
0.74 |
CU utilization (whole-kernel) |
78.8 % |
100 % |
VALU active threads |
45.8 % |
46.7 % |
The win was not from reducing divergence — VALU active threads barely moved — but from hiding the remaining divergence across four times as many in-flight waves per CU. The pattern worth naming is the mixing of profile data, ISA data, and a peer-branch diff into the same diagnostic prompt: none of these sources is sufficient on its own, and AI code-assist tools are well-suited to synthesizing across all three.
Generalizable lesson. Source-level changes and end-to-end timings are the first and last steps of an optimization experiment; the generated assembly and the profiler’s bottleneck view connect them. Prompts that ask the agent to locate a specific phenomenon in the ISA, or to synthesize across a rocprof-compute analyze report plus the latest .s file, turn walls of text into searchable diagnostics — and the developer can jump directly to the line numbers or metric rows quoted and verify the claim.
Pattern 6: Keeping the Agent Honest with Developer-Controlled Checkpoints#
AI code-assist agents produce confident, well-formatted output: a claimed speedup, a claimed register count, a claimed log entry, a claimed commit message. A productive optimization loop treats each of those as a hypothesis that holds only until a developer-controlled mechanism confirms it. No individual check is expensive, but in aggregate they are what prevent a week of apparent progress from turning out to rest on a drifted correctness reference, a misattributed counter, or a commit that pushed more than the developer intended.
Three checkpoints were used throughout this project. Each is a simple, mechanical habit; each caught real mistakes at least once.
Every experiment is gated on the numerical diff, not on the agent’s own timing claim. The 1e-12 reference established in Prompt 2 is checked automatically after each run, and the diff script — not the agent — decides whether a result is bit-identical. This is the single most important guardrail in the workflow: it is what makes it safe for the developer to accept an agent-driven keep-or-revert decision without manually re-inspecting the output every time.
The log is spot-checked against the working tree. Late in the project, after a busy session that included E41 plus the zone-sweep pause, the developer asked:
Prompt 19. Did you document E41 related changes in
experiment_log.md?
The question is short and mechanical; its purpose is to force the agent to re-open the log and cross-reference its latest source edits against the entry for the corresponding experiment. In this case the log was already up to date, but on earlier occasions the same style of prompt caught entries that had been written but not yet extended with the mechanistic post-mortem, or kept experiments whose revert-neighbors had not yet been recorded.
A more insidious failure mode is a log entry that exists, looks well-formed, and reads as a plausible mechanistic explanation — but contains specific technical claims that are simply false. In this project, more than one entry in the early divergence-reduction phase attributed a regression to a v_div_f64 instruction that does not exist in the CDNA2 ISA at all. The agent had produced confident-sounding ISA-level prose because it had been asked to explain a result, not because it had verified the lowered instruction sequence against the assembly. An essential countermeasure is to include in the framing prompt an explicit instruction that the agent ground every mechanistic claim in concrete profile, run, or ISA data — and to refuse to write a post-mortem when no such evidence is available. Periodically re-opening the log next to the source of truth (the .s file, the ISA reference, the profiler CSV) and verifying a sample of entries catches whatever still slips through.
Commits are authored by the agent and executed by the developer. The agent staged the change set and wrote a proposed commit message into a text file, but the developer ran git commit -F commit_msg.txt and git push from their own shell. The convention was set early and restated whenever the agent drifted back toward invoking git itself:
Prompt 20. Write the commit message to a text file so that I can commit myself.
This separation keeps SSH keys and remote-push credentials out of agent-invoked subprocesses, gives the developer one last review of the staged diff against the proposed message (catching mis-scoped commits before they reach the public fork), and makes the public git history a record of the developer’s intentional choices rather than of the agent’s step-by-step workflow.
Generalizable lesson. The correctness diff, the log spot-check, and the manually-dispatched commit are three instances of the same principle: every agent output that propagates beyond the current session should pass through a developer-controlled checkpoint on the way. The checkpoints do not have to be elaborate — a one-line diff, a one-sentence prompt, or a manually-run git commit is enough, as long as the habit is routine and non-optional.
Pattern 7: Documenting Reverts as Carefully as Keeps#
The experiment-loop prompt was explicit about stopping after a run of unsuccessful attempts, but silent about what to do with those unsuccessful experiments. The convention that emerged — and that the agent adopted without further prompting — was to keep each failed experiment in experiment_log.md with a full post-mortem rather than collapsing it into a footnote. By the end of the project the log contained more fully-documented reverts than kept experiments. A representative sample follows; the “Cause” column reproduces the post-mortem from the log at the time, which — as Pattern 6 cautions — may include agent-attributed mechanism explanations rather than independently verified findings:
Exp |
Change |
Result |
Cause captured in the log |
|---|---|---|---|
E02 |
Remove a guarded |
+4.4 % |
Static metrics improved (VGPRs 103→93, occupancy 4→5 waves/SIMD) but wall time regressed — the counter-intuitive result that seeded the “kernel is latency-bound on global-memory gathers, not occupancy-bound” diagnosis of Pattern 1. Reverted. |
E03 |
Add |
+5.3 % |
Compiler hoisted loads more aggressively under the no-alias guarantee, creating longer live ranges and register pressure. Reverted. |
E22 |
Branchless asymptotic-vs-Euler update (compute both, select) |
+0.77 % |
The always-compute-both form introduced an extra FP64 division on every i-iteration (including on lanes that would have taken the cheaper Euler path), outweighing the divergence saved on a low-frequency branch. Reverted. |
E38 |
Move a hot LDS array back to global device memory |
+2.8 % |
LDS budget improved but occupancy gate not cleared; HBM-traffic cost paid without compensating benefit. Reverted. |
E39 (first attempt) |
Manual two-accumulator unroll of the inner reduction loop |
+2.4 % |
Compiler was already pipelining effectively; manual unroll added VGPR pressure and tail-branch overhead. Reverted. |
E42 |
Hoist timestep-invariant state-index bounds out of the inner timestep loop |
+1.6 % |
Broadcast values should have landed in SGPRs but went to VGPRs instead, creating lifetime pressure that hurt scheduling. Reverted. |
E43 |
|
+4.3 % |
Compiler’s default scheduling beat the manual unroll hint. Reverted. |
E44 |
Move both hot LDS arrays (the rate-coefficient and update-accumulator buffers) to global |
+3.6 % to +3.9 % across the full zone sweep |
LDS dropped from 44.6 KB to 19.6 KB (under the 32 KB gate), but |
E45 |
|
+3.9 % |
Compiler refused to spill aggressively; VGPR dropped from 112 to 104 via scheduling only, SGPR unchanged at 112 (over the 96-per-wave gate). The SGPR pressure traced to the kernel’s roughly 30 pointer arguments, each consuming two SGPRs while live. Reverted. |
Generalizable lesson. Negative experiments deserve the same documentation discipline as positive ones, and the post-mortem should be written in the same session as the revert — while the compiler flags, the profiler output, and the design intent are still in context. AI code-assist tools are a good fit for this because the contextual information is already in the conversation. The cumulative artifact is a log that prevents the common failure mode of I forget why we didn’t take this path a few days ago, let me try it again.
Discussion#
Across approximately 45 recorded experiments the kernel ran 28.3× faster[1] while remaining bit-identical to the original at 1e-12 relative tolerance. The AI code-assist tool contributed in four specific ways:
Mechanical refactoring of LDS layouts, bit-packing, and host-side allocations across many call sites, with far lower error rate than the same work done manually.
Enforced documentation of every experiment — plan, hypothesis, result, decision — in a single log file that replaced developer recall.
Reproducible tooling around
sbatchsubmissions,rocprofv3 --kernel-traceCSV parsing, and numericaldiffagainst reference outputs, all as scripted operations invoked by a single prompt.Clean handling of negative results, including automated reverts via
git stashand post-mortems that prevented repeated variants of the same failed idea.
The developer’s contribution was direction: when to pursue algorithmic versus occupancy changes, when to request hardware counters rather than propose another experiment, and when to stop. The tool’s contribution was compressing the per-experiment loop from hours to tens of minutes and removing the bookkeeping overhead that otherwise grows with experiment count.
Once the shared log and reusable scripts were in place, the effective prompt length shrank dramatically — many of the most consequential course corrections late in the project were single clauses, only actionable because experiment_log.md and the on-disk scripts had already established the context. The productivity multiplier of an AI code-assist tool is as much about how little needs to be typed per decision as it is about how many lines of code are generated per prompt. The practical recommendation that follows: establish the correctness check, canonical timing configuration, shared optimization log, and developer-controlled commit workflow on day one.
A note on transferability. The 28.3× headline result reflects a kernel that had substantial untapped headroom at the start — large amounts of HBM traffic that could be moved into LDS, a pow(x, 1.0/3.0) call that expanded into hundreds of ISA instructions, and several other patterns that profiling immediately surfaced. Applying the same workflow to a kernel that has already been carefully hand-tuned, or that is already memory-bandwidth- or compute-bound at peak will produce a much smaller cumulative speedup. What does transfer is the workflow — the day-one foundations, the per-experiment loop, the discipline around negative results, and the productivity multiplier of an AI code-assist tool once the supporting infrastructure exists.
A note on the blog itself. This post was also drafted and iteratively refined through interactions with the same AI code-assist tool. Every factual claim, prompt quote, and measured number was cross-checked by the developer against experiment_log.md and the transcript of the original optimization sessions.
Summary#
In this blog you followed a real, end-to-end GPU kernel optimization campaign on AMD Instinct MI250 hardware, driven by a developer working side-by-side with an AI code-assist tool. Along the way you saw how to:
Set up the day-one foundations — a bit-identity correctness check, a canonical timing configuration, a shared
experiment_log.md, and a developer-controlled commit workflow — that make every later experiment compound.Use
rocprofv3 --kernel-traceand other ROCm profiling tools to diagnose occupancy, LDS, VGPR/SGPR, and memory-traffic bottlenecks, and turn those readings into concrete code changes.Prompt an AI code-assist tool effectively across roughly 45 experiments — from multi-sentence framing prompts to single-clause course corrections — and let the shared log and reusable scripts carry the context that prompts no longer have to re-establish.
Treat negative results as first-class artifacts, with
git stash-based reverts and post-mortems that stop the same failed idea from coming back a week later.Combine all of the above to reach a 28.3× speed-up[1] over the original kernel while remaining bit-identical at 1e-12 relative tolerance.
What’s next#
This post wraps up the current five-part Performance Profiling on AMD GPUs series, but the team is not done. Expect more applied optimization case studies in the same spirit as this one — a real workload, a real profiler trace, and the experiment-by-experiment path from baseline to a measurable speed-up — alongside topics such as:
Advanced thread tracing with
rocprofiler-sdkandrocprofv3. A deep dive into the new thread-trace capability — what it captures at the wavefront level, how to drive it fromrocprofv3, and how to visualize the resulting traces to diagnose issues that hardware counters alone cannot explain.Profiling for AI workloads. A focused look at the profiling tool features across the ROCm stack that are most useful for AI training and inference workloads rather than traditional HPC codes.
If there is a profiling topic, workload type, or tool feature you would like the team to cover next, the comment thread on this blog is a good place to let us know.
Disclaimers#
The information presented in this document is for informational purposes only and may contain technical inaccuracies, omissions, and typographical errors. The information contained herein is subject to change and may be rendered inaccurate for many reasons, including but not limited to product and roadmap changes, component and motherboard version changes, new model and/or product releases, product differences between differing manufacturers, software changes, BIOS flashes, firmware upgrades, or the like. Any computer system has risks of security vulnerabilities that cannot be completely prevented or mitigated. AMD assumes no obligation to update or otherwise correct or revise this information. However, AMD reserves the right to revise this information and to make changes from time to time to the content hereof without obligation of AMD to notify any person of such revisions or changes. THIS INFORMATION IS PROVIDED ‘AS IS.” AMD MAKES NO REPRESENTATIONS OR WARRANTIES WITH RESPECT TO THE CONTENTS HEREOF AND ASSUMES NO RESPONSIBILITY FOR ANY INACCURACIES, ERRORS, OR OMISSIONS THAT MAY APPEAR IN THIS INFORMATION. AMD SPECIFICALLY DISCLAIMS ANY IMPLIED WARRANTIES OF NON-INFRINGEMENT, MERCHANTABILITY, OR FITNESS FOR ANY PARTICULAR PURPOSE. IN NO EVENT WILL AMD BE LIABLE TO ANY PERSON FOR ANY RELIANCE, DIRECT, INDIRECT, SPECIAL, OR OTHER CONSEQUENTIAL DAMAGES ARISING FROM THE USE OF ANY INFORMATION CONTAINED HEREIN, EVEN IF AMD IS EXPRESSLY ADVISED OF THE POSSIBILITY OF SUCH DAMAGES. AMD, the AMD Arrow logo, and combinations thereof are trademarks of Advanced Micro Devices, Inc. Other product names used in this publication are for identification purposes only and may be trademarks of their respective companies. © 2026 Advanced Micro Devices, Inc. All rights reserved.
Third-party content is licensed to you directly by the third party that owns the content and is not licensed to you by AMD. ALL LINKED THIRD-PARTY CONTENT IS PROVIDED “AS IS” WITHOUT A WARRANTY OF ANY KIND. USE OF SUCH THIRD-PARTY CONTENT IS DONE AT YOUR SOLE DISCRETION AND UNDER NO CIRCUMSTANCES WILL AMD BE LIABLE TO YOU FOR ANY THIRD-PARTY CONTENT. YOU ASSUME ALL RISK AND ARE SOLELY RESPONSIBLE FOR ANY DAMAGES THAT MAY ARISE FROM YOUR USE OF THIRD-PARTY CONTENT.
Cursor is a trademark of Anysphere Inc. Anthropic and Claude are trademarks of Anthropic, PBC. Visual Studio Code is a trademark of Microsoft Corporation.
Additional Resources#
Performance Profiling on AMD GPUs – Part 1: Foundations. https://rocm.blogs.amd.com/software-tools-optimization/profiling-guide/intro/README.html
Performance Profiling on AMD GPUs – Part 2: Basic Usage. https://rocm.blogs.amd.com/software-tools-optimization/profiling-guide/novice/README.html
Performance Profiling on AMD GPUs – Part 3: Advanced Usage. https://rocm.blogs.amd.com/software-tools-optimization/profiling-guide/advanced/README.html
Performance Profiling on AMD GPUs – Part 4: Fortran OpenMP Offload Edition. https://rocm.blogs.amd.com/software-tools-optimization/profiling-guide/fortran_openmp/README.html
Introduction to profiling tools for AMD hardware. https://rocm.blogs.amd.com/software-tools-optimization/profilers/README.html
HIP Programming Guide. https://rocm.docs.amd.com/projects/HIP/en/latest/
AMD Instinct MI200-series (CDNA2) Instruction Set Architecture Reference Guide. https://www.amd.com/content/dam/amd/en/documents/instinct-tech-docs/instruction-set-architectures/instinct-mi200-cdna2-instruction-set-architecture.pdf
AMD Instinct MI250 product page. https://www.amd.com/en/products/accelerators/instinct/mi200/mi250.html
Cursor IDE documentation. https://docs.cursor.com/